Impactomics
Redesigning a legacy genomics tool into an AI-powered platform for faster, more confident clinical decisions.
A platform built for
the start of a long journey.
In India alone, an estimated 72 to 96 million people live with a rare disease, and many go undiagnosed because awareness is low and the path to a clear answer is slow. Impactomics sits at the very start of that path. If clinicians can interpret genetic data faster and with more confidence, patients get to treatment and care sooner.
It worked.
But it was hard to use.
The interface was dense and unintuitive. Clinicians, geneticists, and analysts struggled to move through the tool, interpret genetic data, and produce reports. That friction slowed the diagnostic process at exactly the moments when speed matters most.
The Legacy Interface
Challenges
The design had to become simpler without sacrificing scientific accuracy or clinical detail.
Germline, trio, and somatic variant analysis workflows had to be simplified carefully without losing rigour.
Cognitive load had to come down while clinical relevance stayed fully intact.
Framing the Problem with the 5Ws
What is the platform, what tasks do users carry out, and what feels outdated or hard to use?
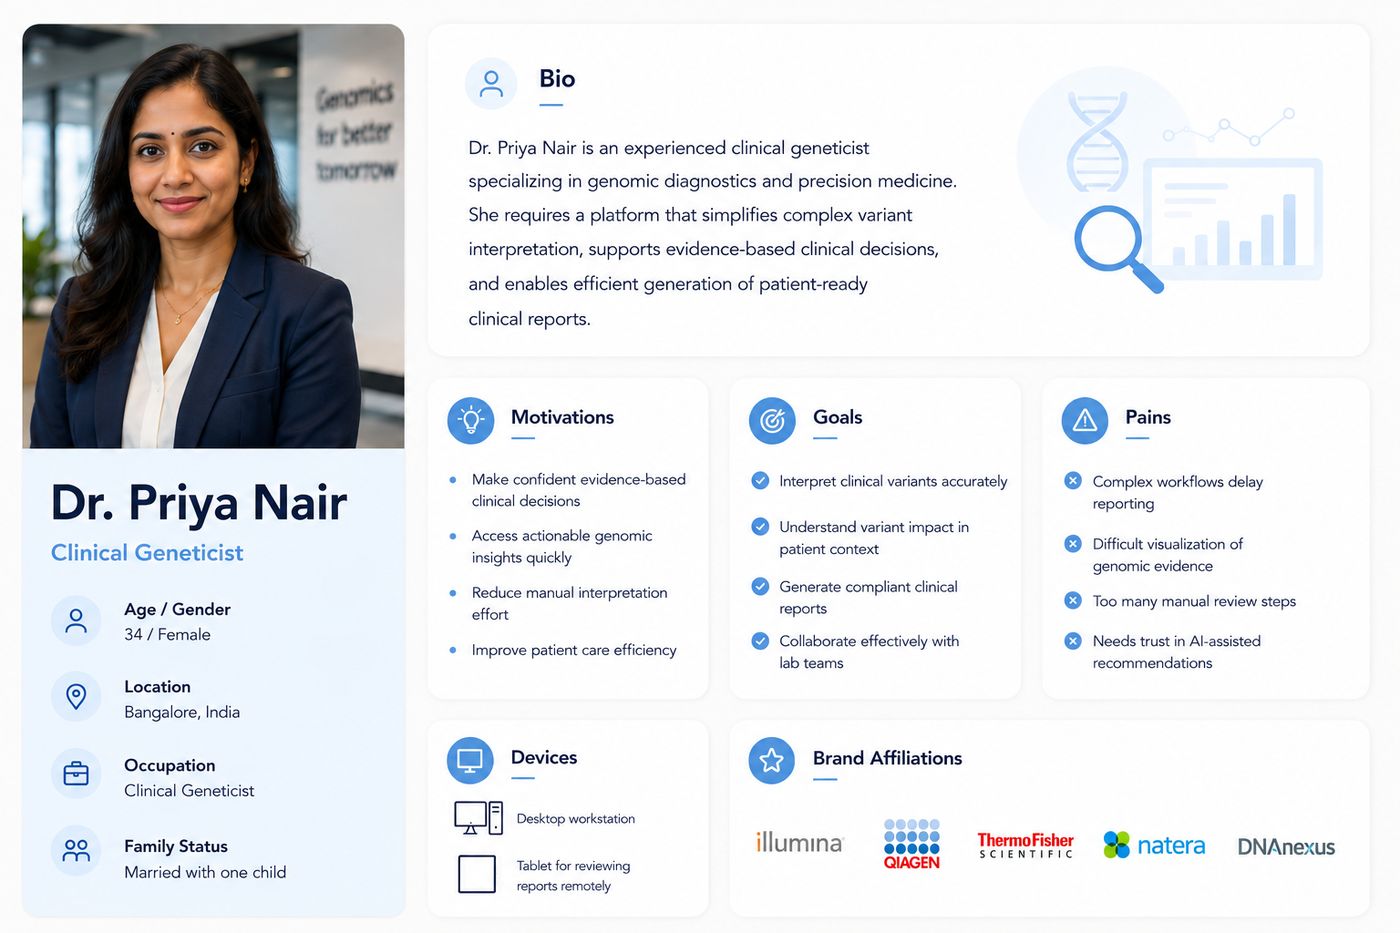
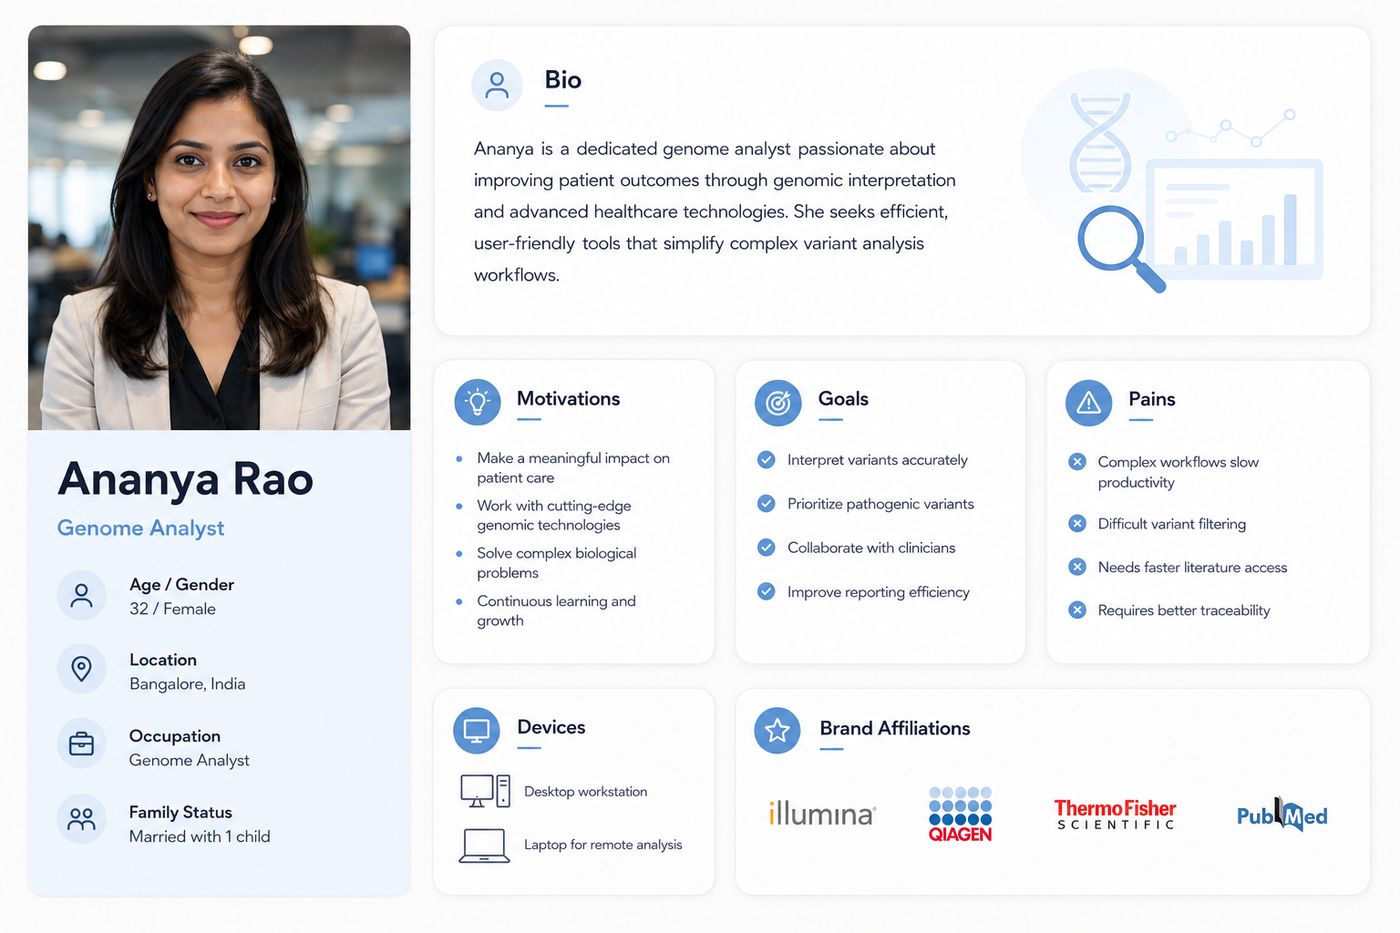
Genome analysts, clinical geneticists, genetic counsellors, lab technicians — and the stakeholders driving the redesign.
When in their workflow do users hit delays and friction?
Where is the tool used, where does it connect to other systems, and where do users get stuck?
Why is a redesign needed now, and why are some features avoided or underused?
Secondary research,
competitive analysis,
and five real users.
I began by studying the existing product and the business requirements, working closely with stakeholders to understand what the platform needed to achieve.
Competitive Analysis
| Platform | Variant annotation | AI prioritisation | Workflow simplicity | Key gap |
|---|---|---|---|---|
| Franklin Genoox | Strong | Strong | Steep learning curve | Complex navigation |
| VarSome | Strong | Medium | Medium | Inconsistent visual hierarchy |
| QCI Interpret | Strong | Strong | Complex | No real-time collaboration |
| Sophia Genetics | Strong | Strong | Steep | Flexible reporting limited |
User Interviews
I interviewed five users — clinicians and genome analysts based in Bangalore, over video call. A colleague captured responses while I focused on how users behaved and reacted, not just what they said. Conversations covered daily workflow, friction points, report generation, data overload, onboarding difficulty, and confidence in AI suggestions.
Organising what we heard
into what actually matters.
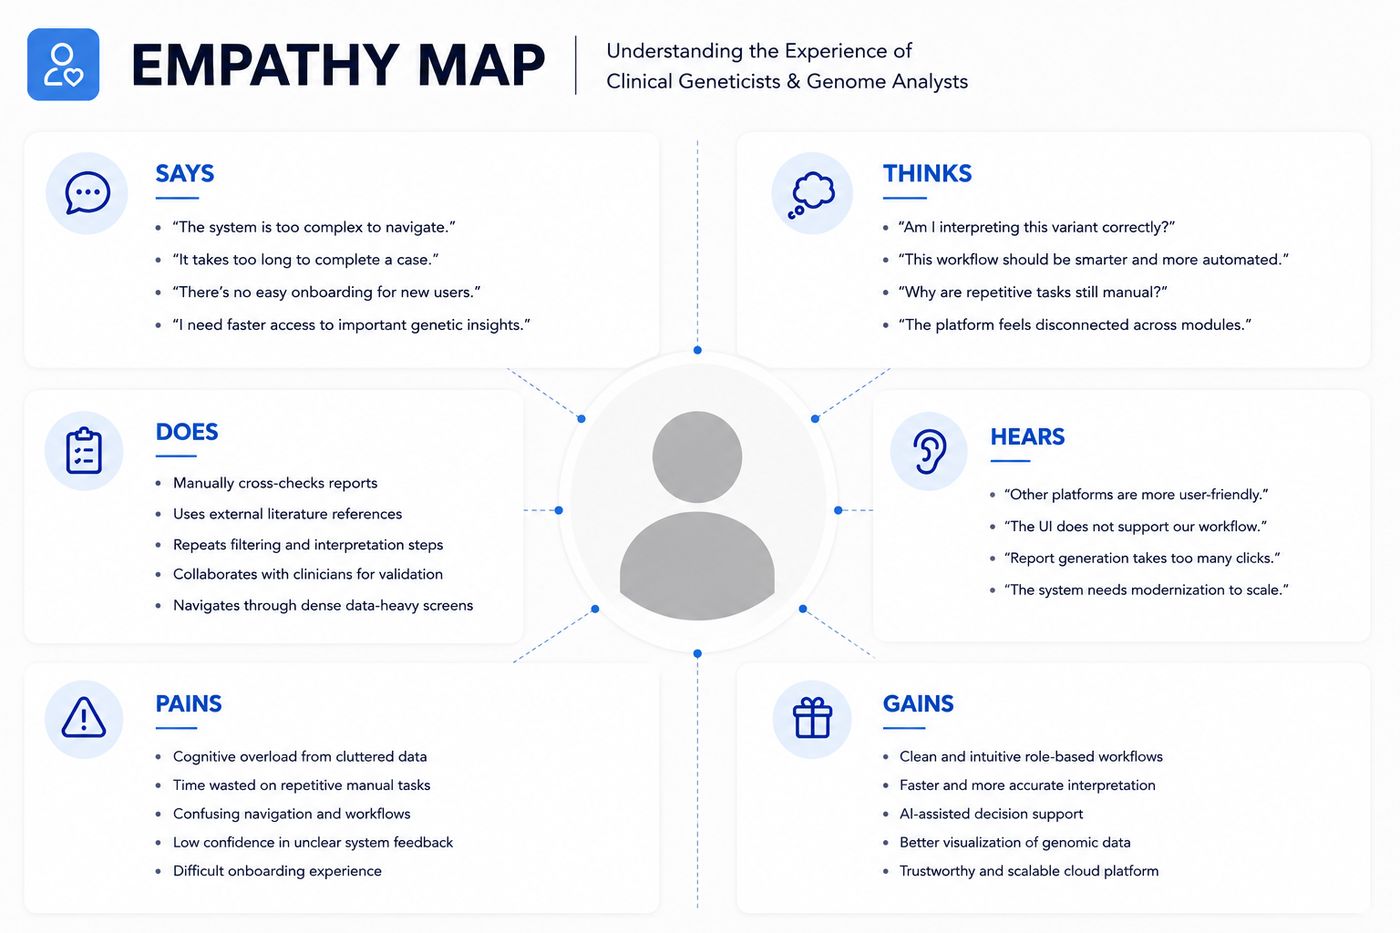
I organised everything gathered and analysed it to define the real problem. From there I built personas and an empathy map to keep the team grounded in the user’s reality.
Clinicians struggle with a complex, unintuitive interface. Users feel overwhelmed by genetic data volume. Navigation and reporting lack clarity. First-time users face a steep learning curve. Users lack confidence because system feedback is unclear.
A simple, guided workflow for running analysis and generating reports. A fast way to find key genetic insights. A clearer visual interface that genuinely supports decision-making. Reassurance and clarity at each step.
Personas
Empathy Map
How Might We
Use AI and cloud technology to speed up genomic analysis for clinical use.
Simplify variant interpretation by cutting unnecessary clicks and reducing information overload.
Generate clinical reports automatically, with meaningful insights and recommendations.
Let users tailor their dashboard to their role and needs.
Enable real-time collaboration so teams can review and discuss data together.
Make variant history easy to track and share within a team.
Flow before screens.
Structure before style.
Before any visual design, I wanted the whole team to share the same picture of how the application should work. So I started with the flow.
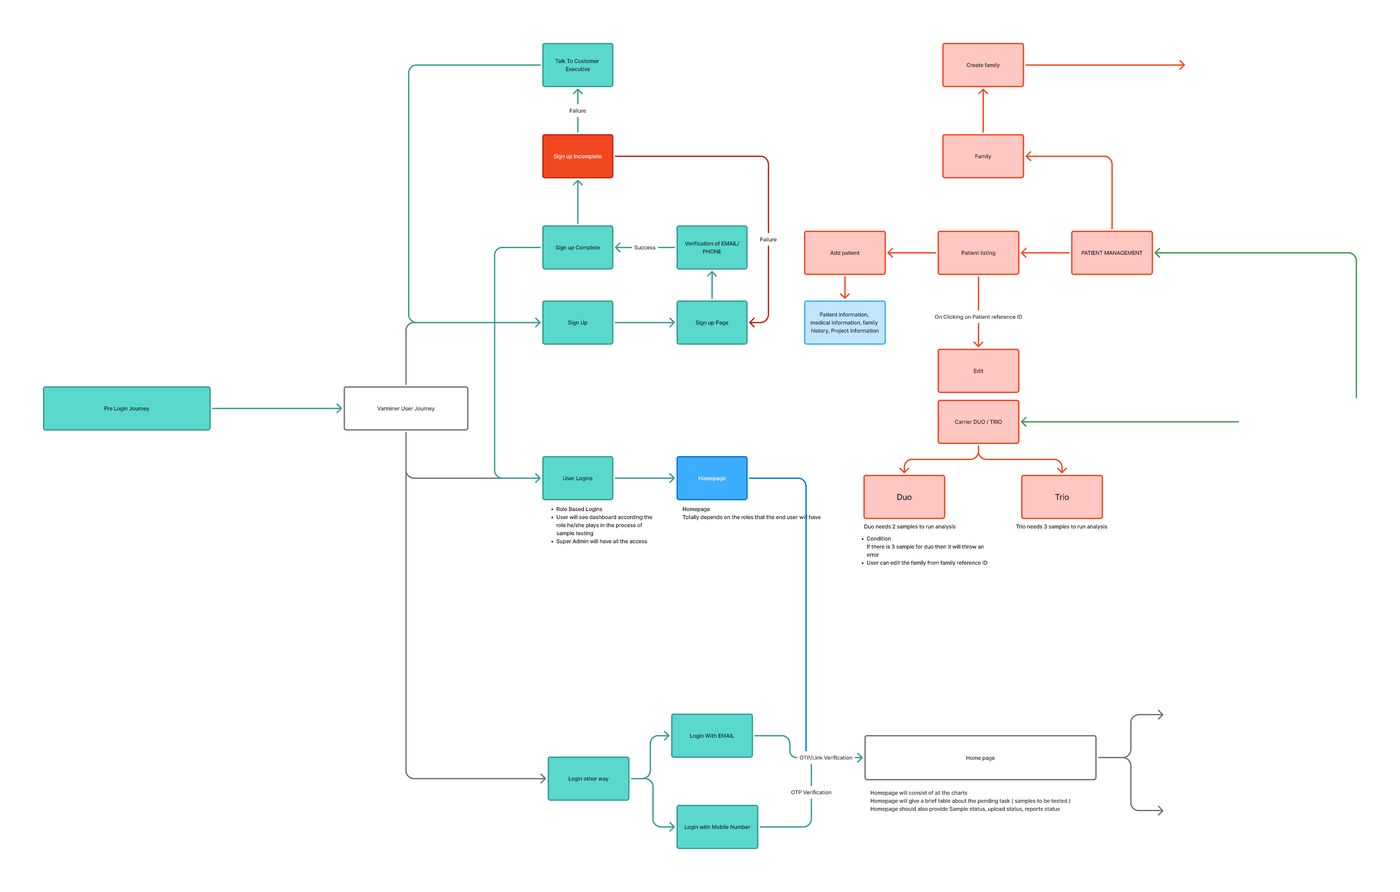
User Flows
I mapped the end-to-end experience first, so the structure was agreed before we touched screen design.
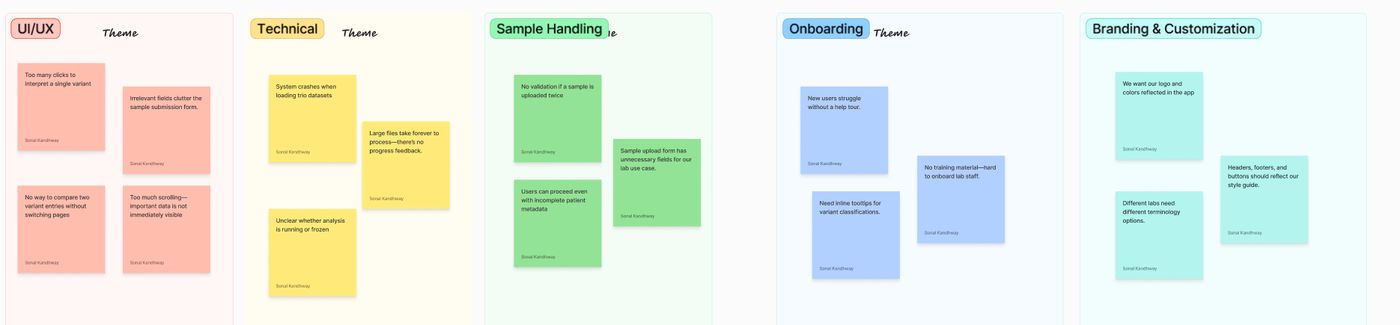
Affinity Mapping
With stakeholders, we debated user problems and the existing solution. Affinity mapping clustered the thinking into clear themes: UI/UX, Technical, Sample Handling, Onboarding, and Branding & Customisation.
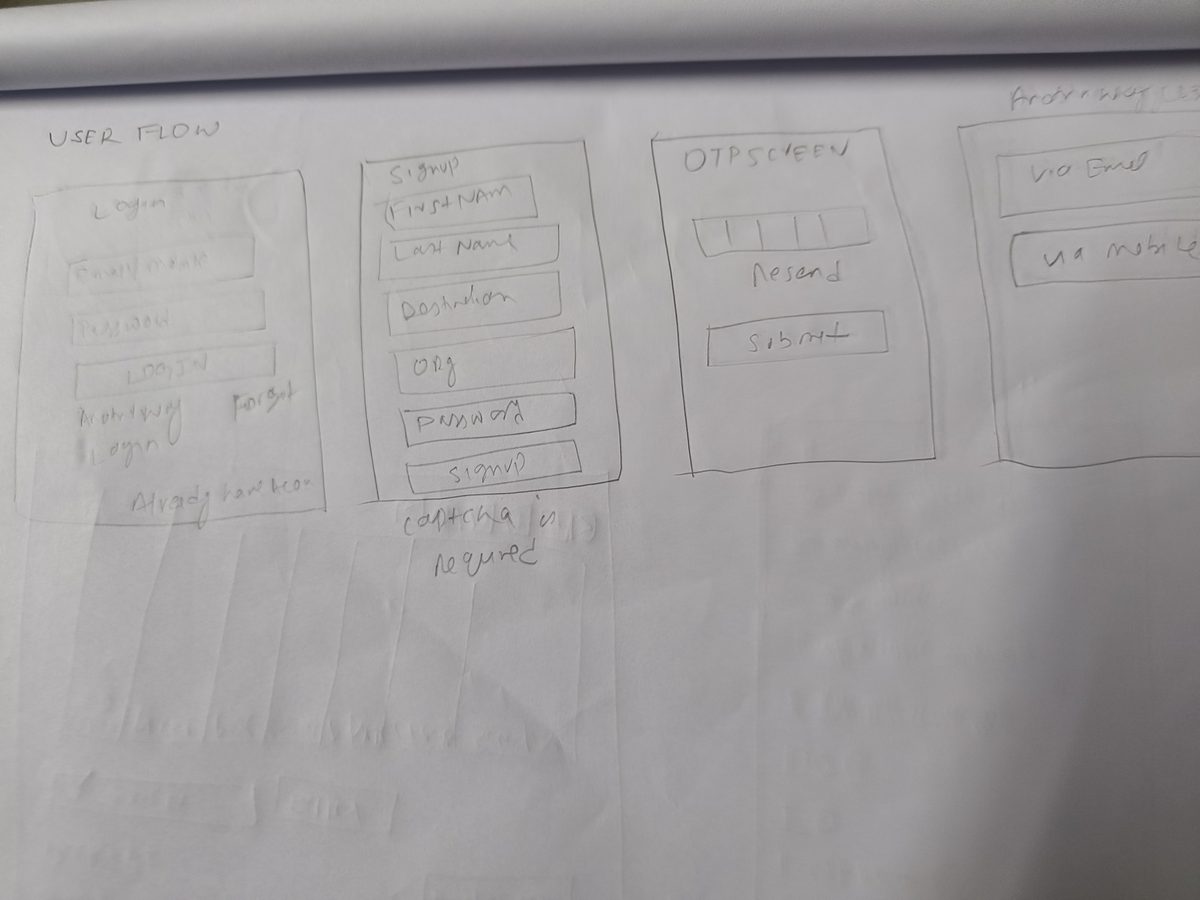
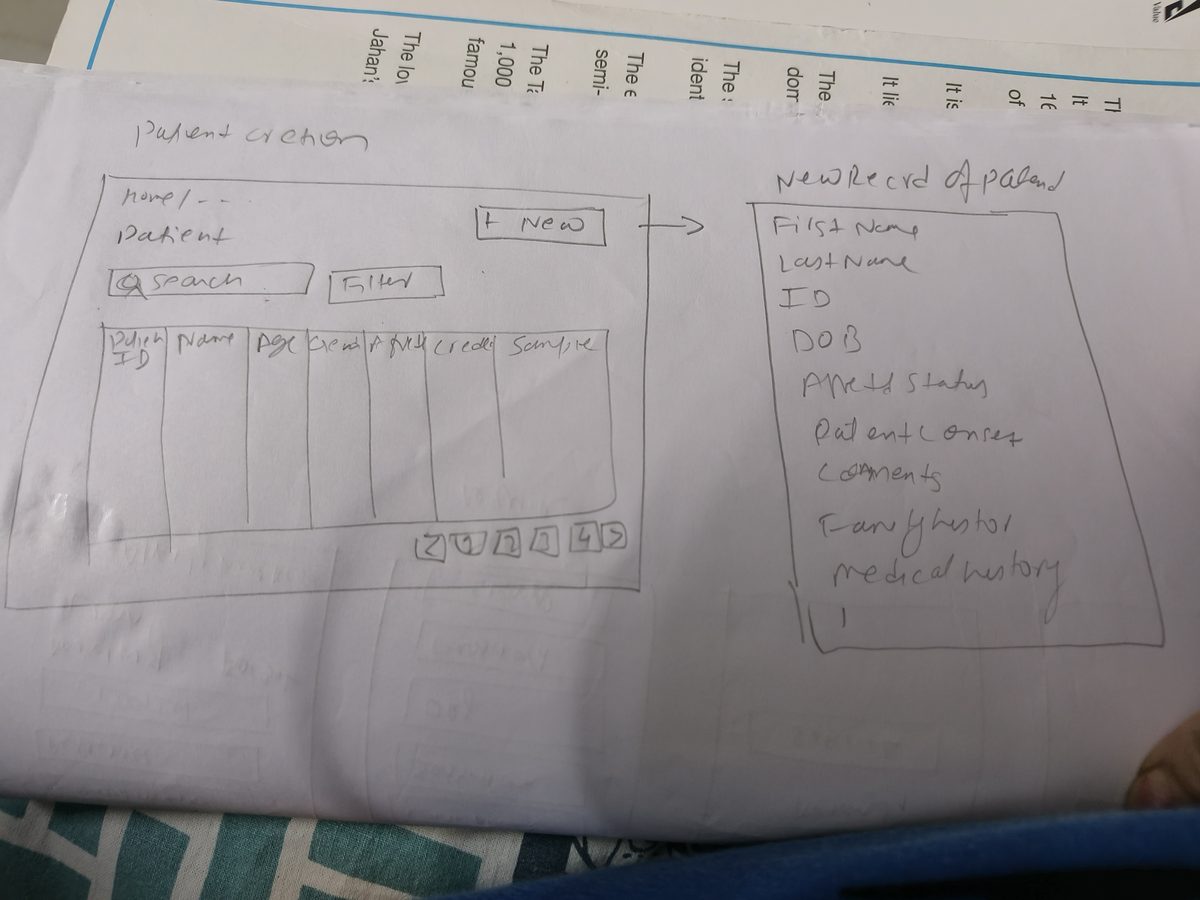
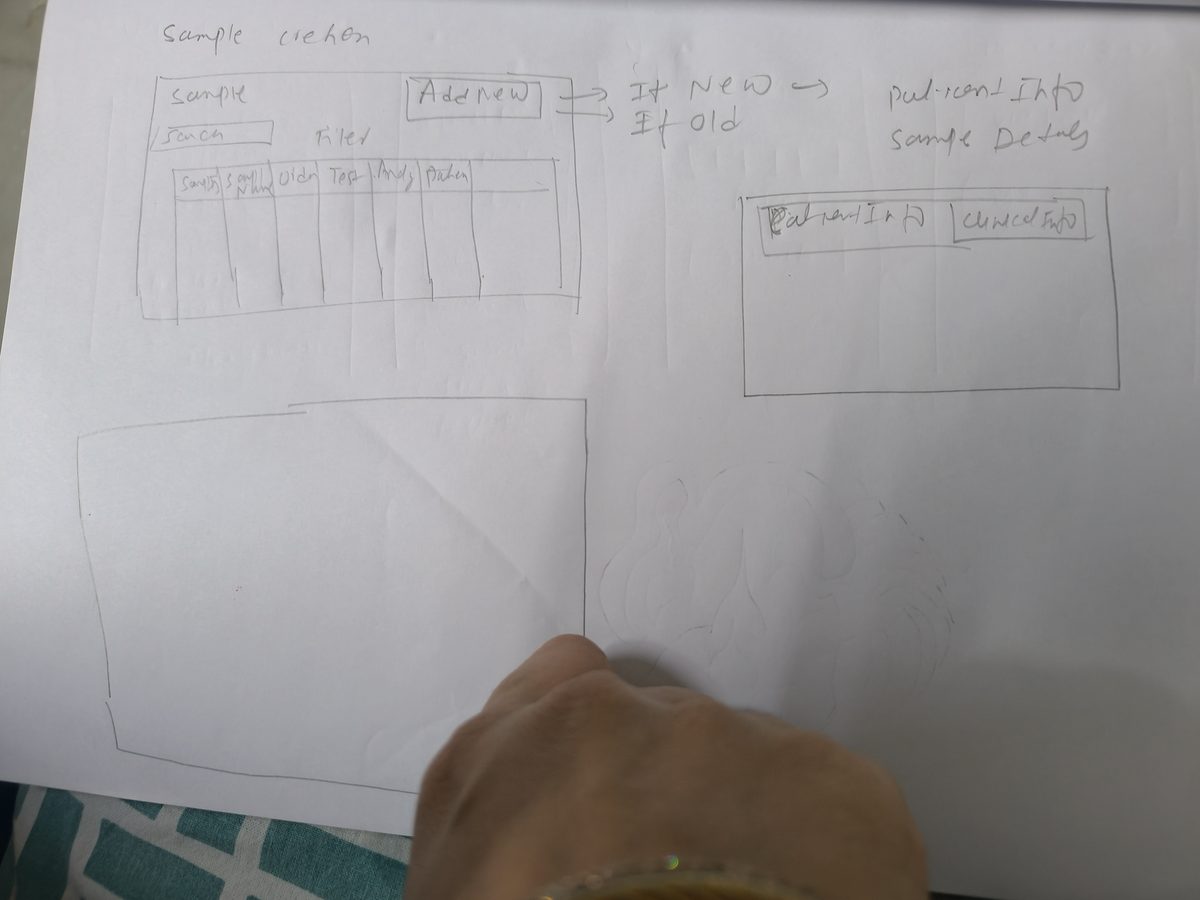
Paper Sketches
I explored layout ideas quickly on paper before committing to anything digital.
Low-Fidelity Wireframes
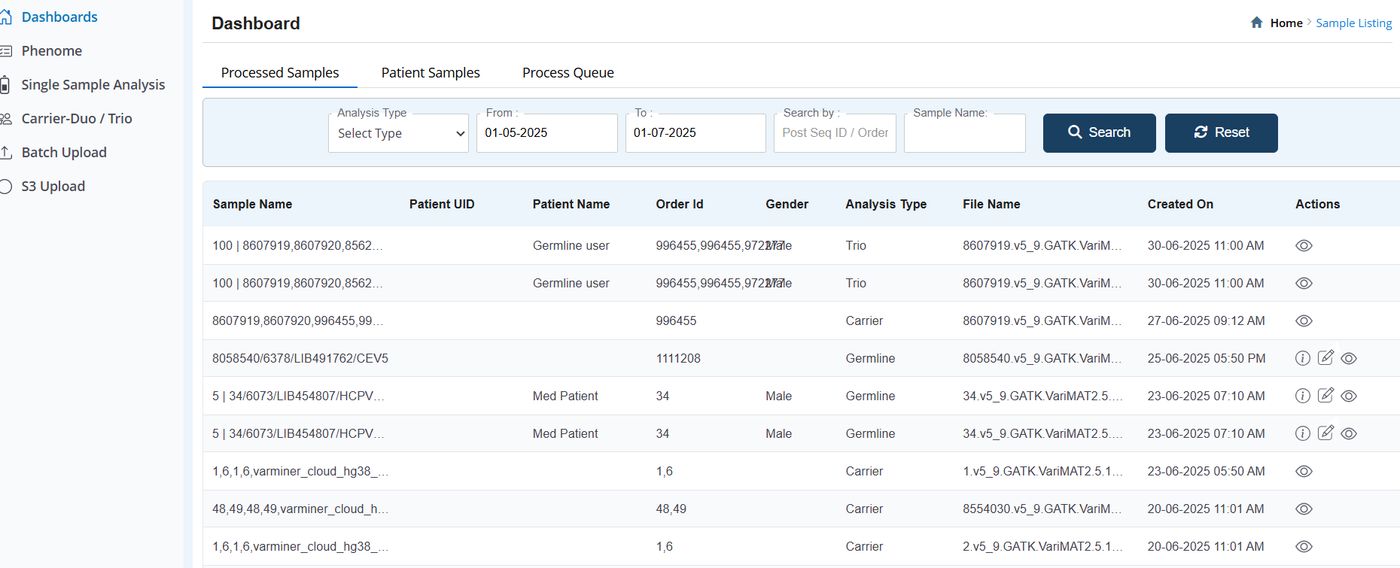
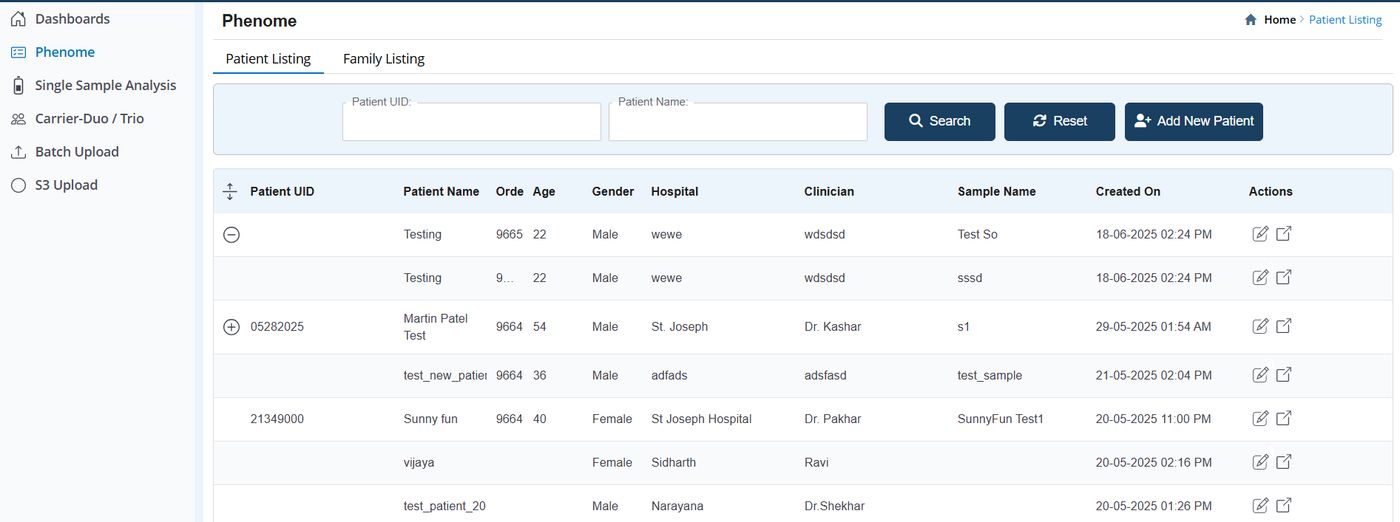
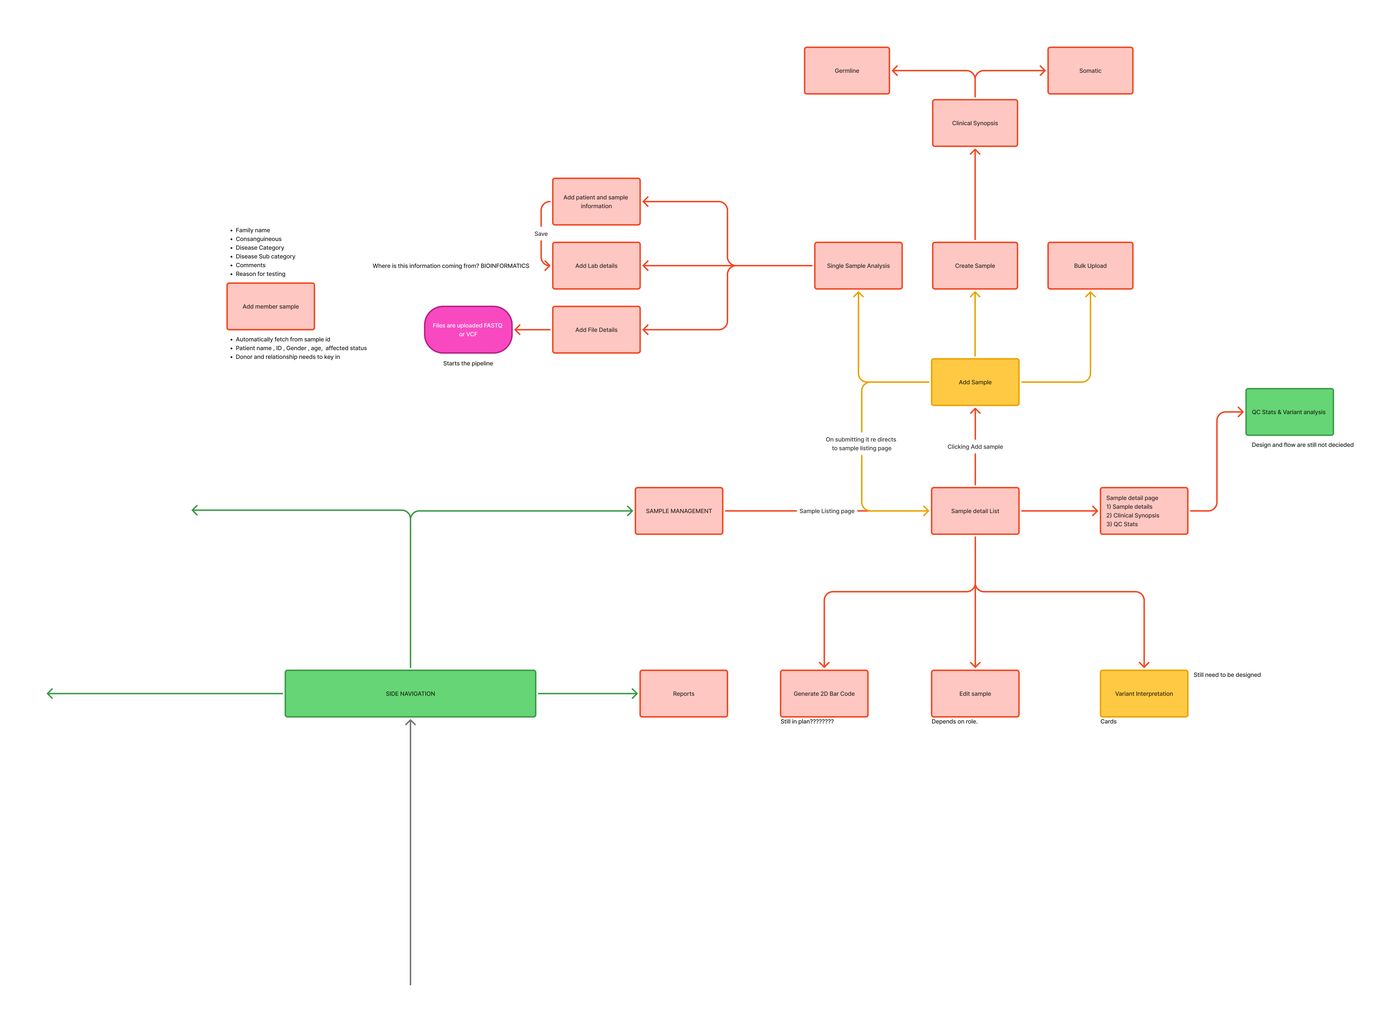
Low-fidelity wireframes covered the core areas: login/signup, Patient Management, Sample Management, Family Management, and Variant Interpretation. These let me test structure and layout before visual detail.
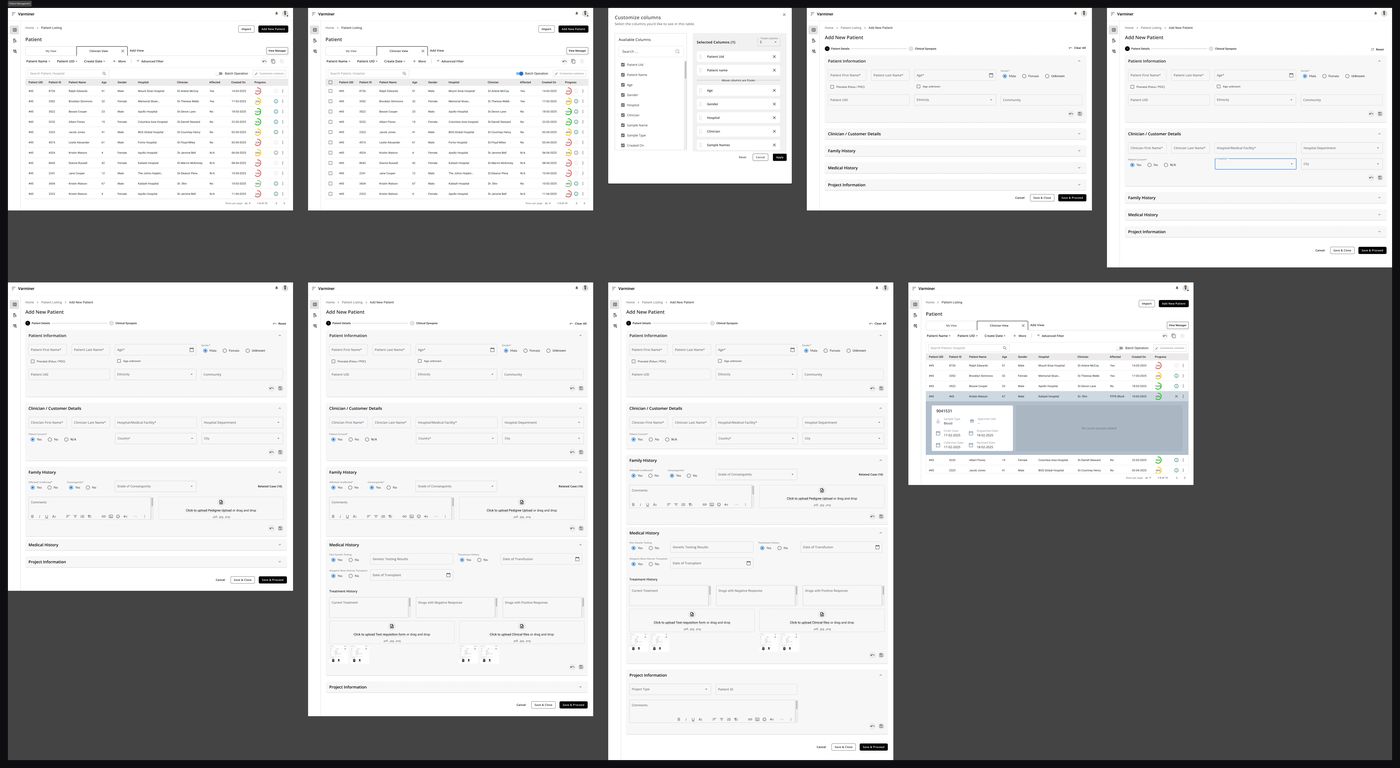
Patient listing, details, and add patient with validation states — the core clinical workflow.
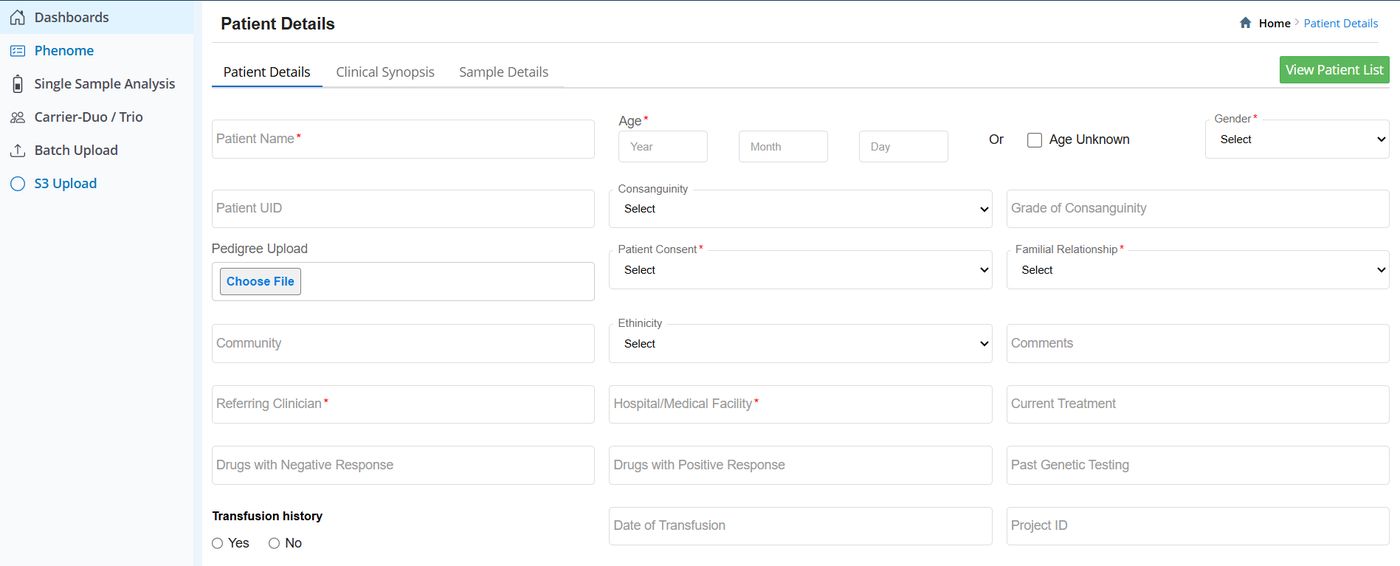
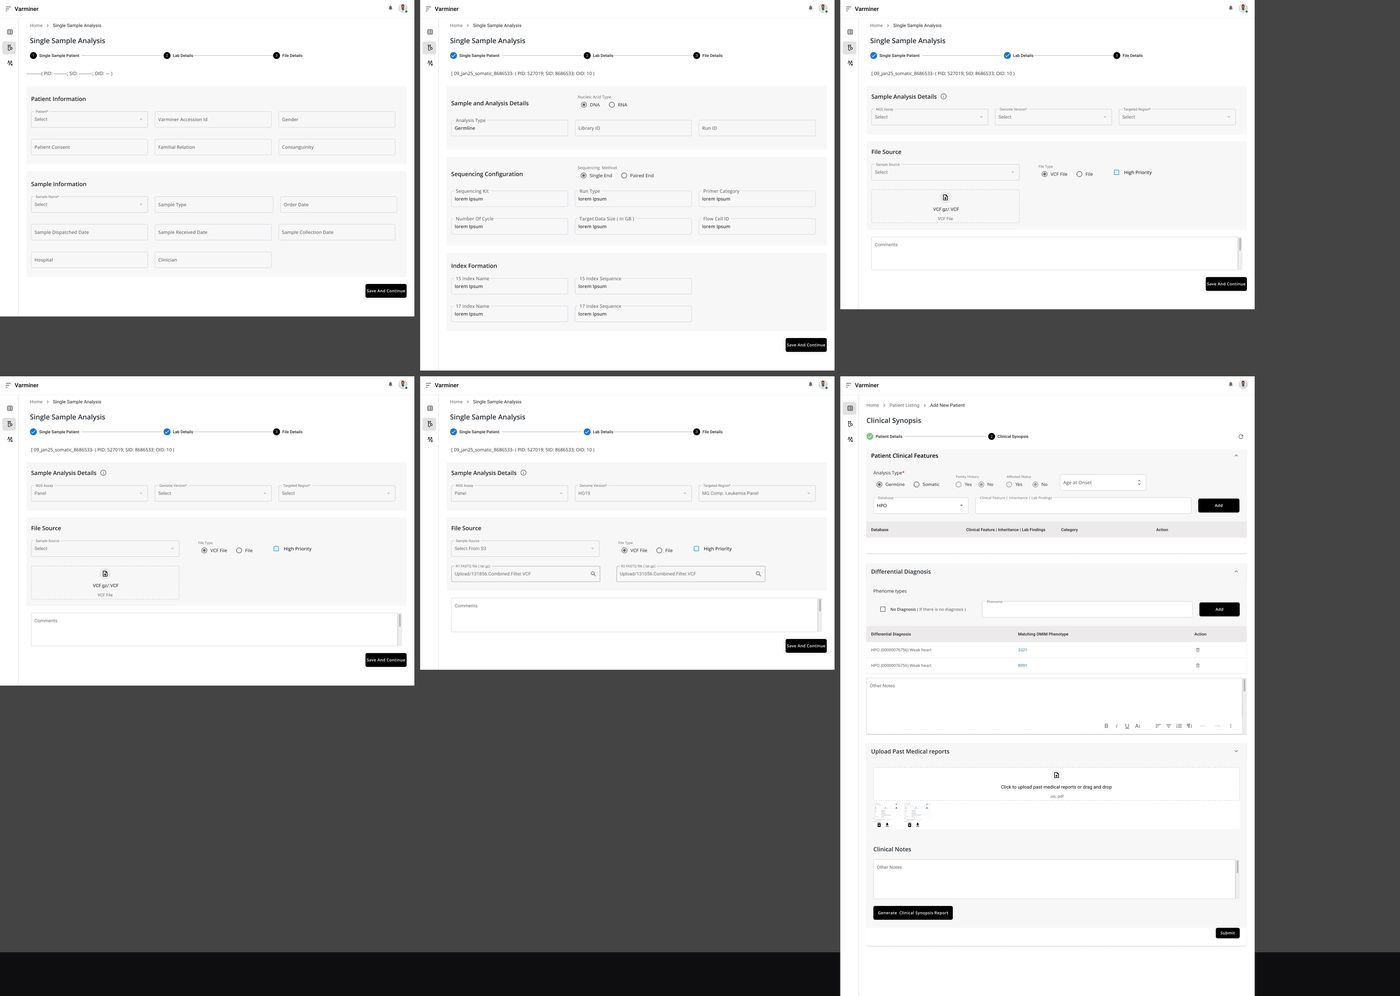
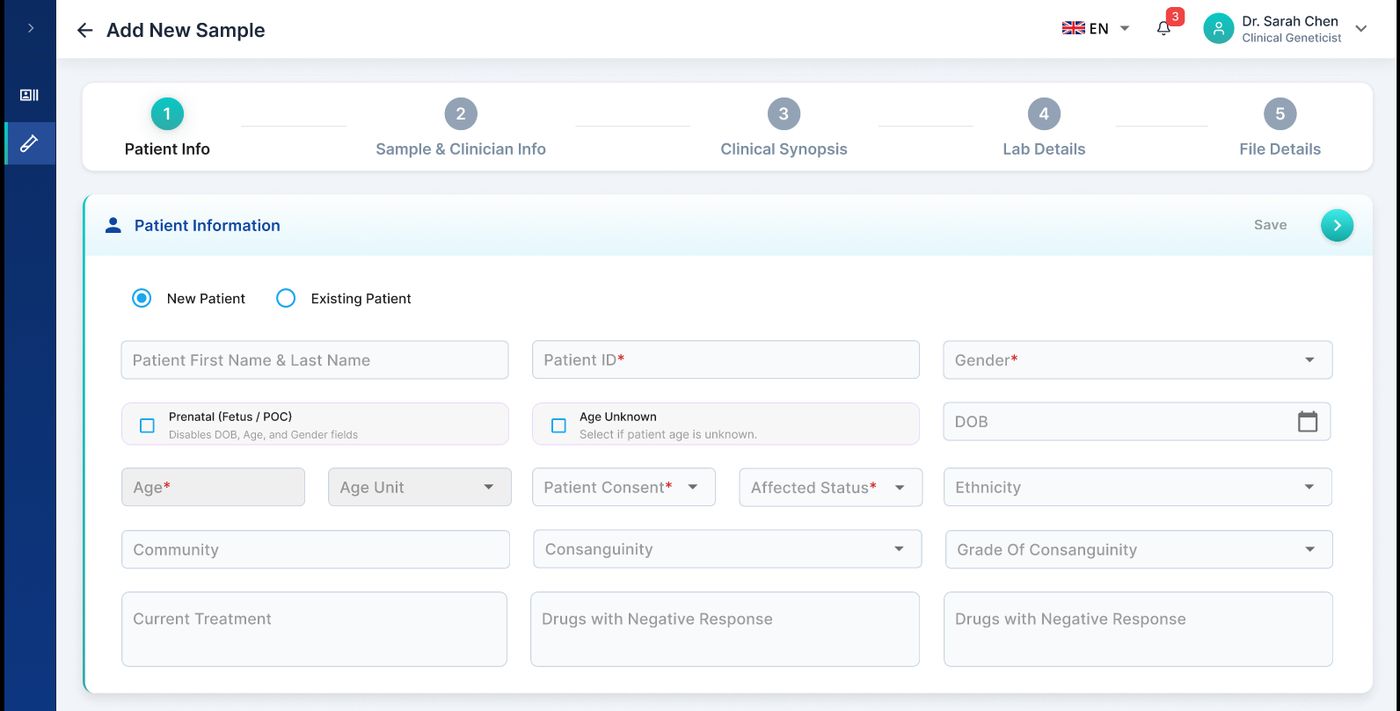
Stepped form for single sample analysis — patient info, lab details, file details, clinical synopsis.
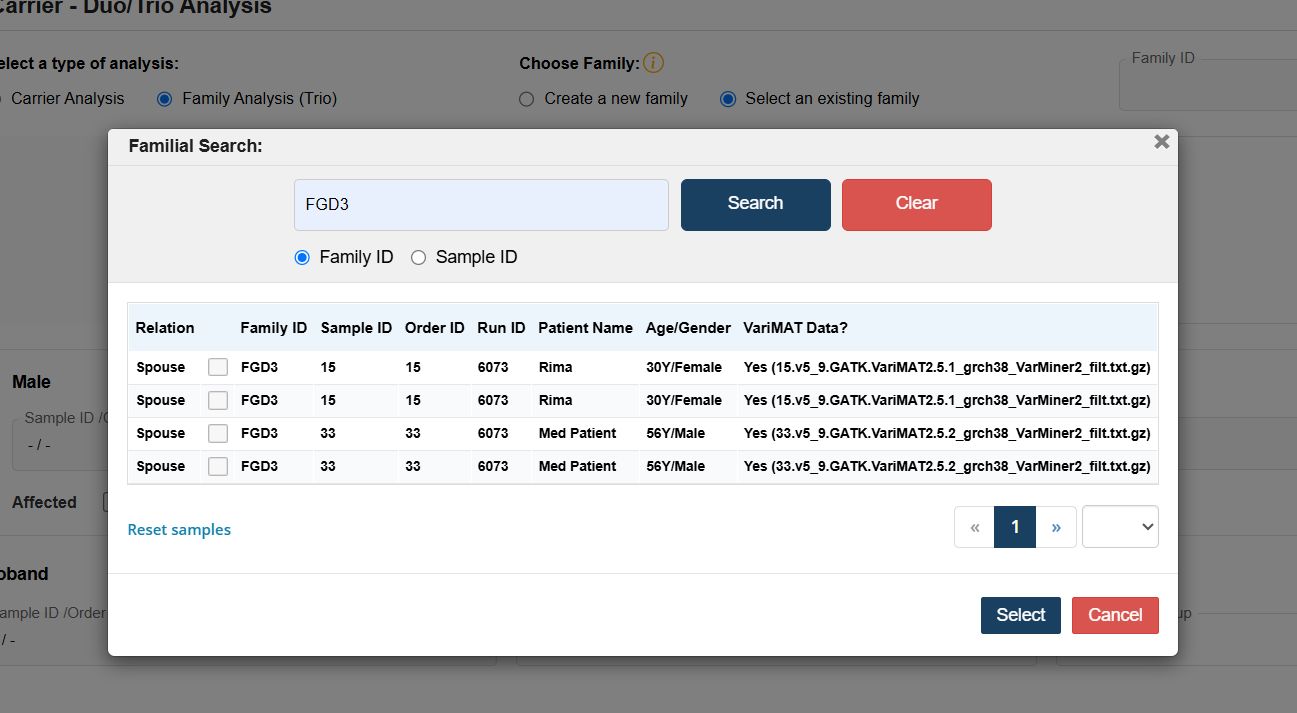
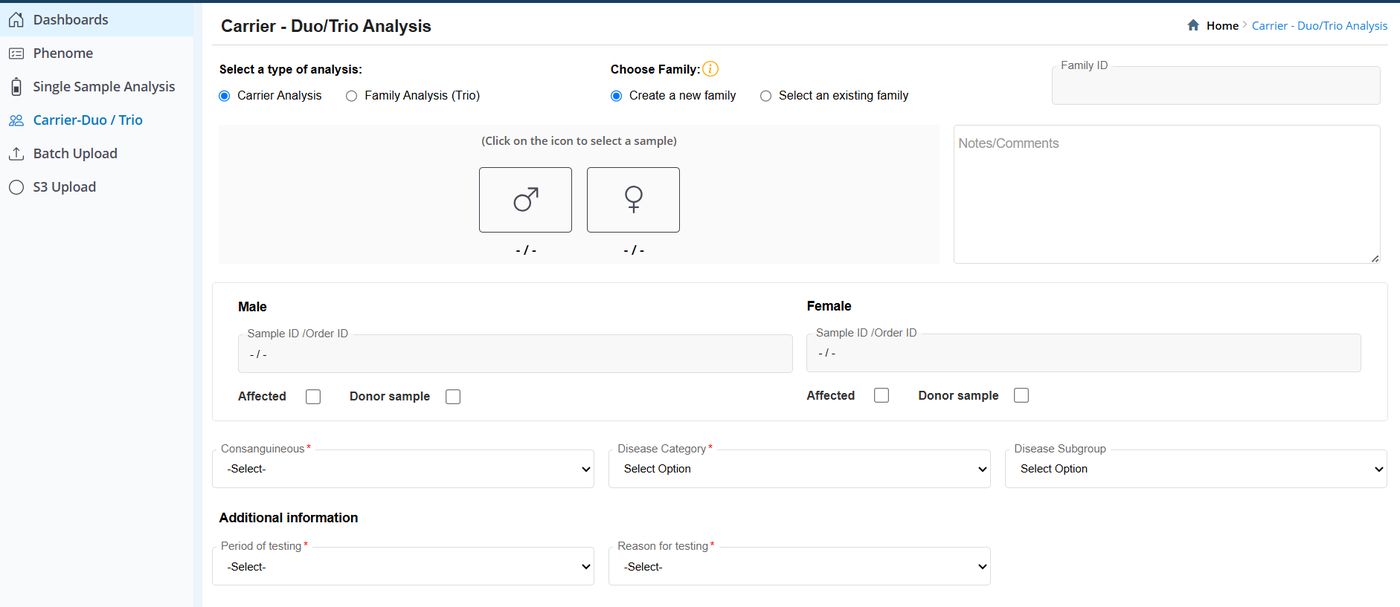
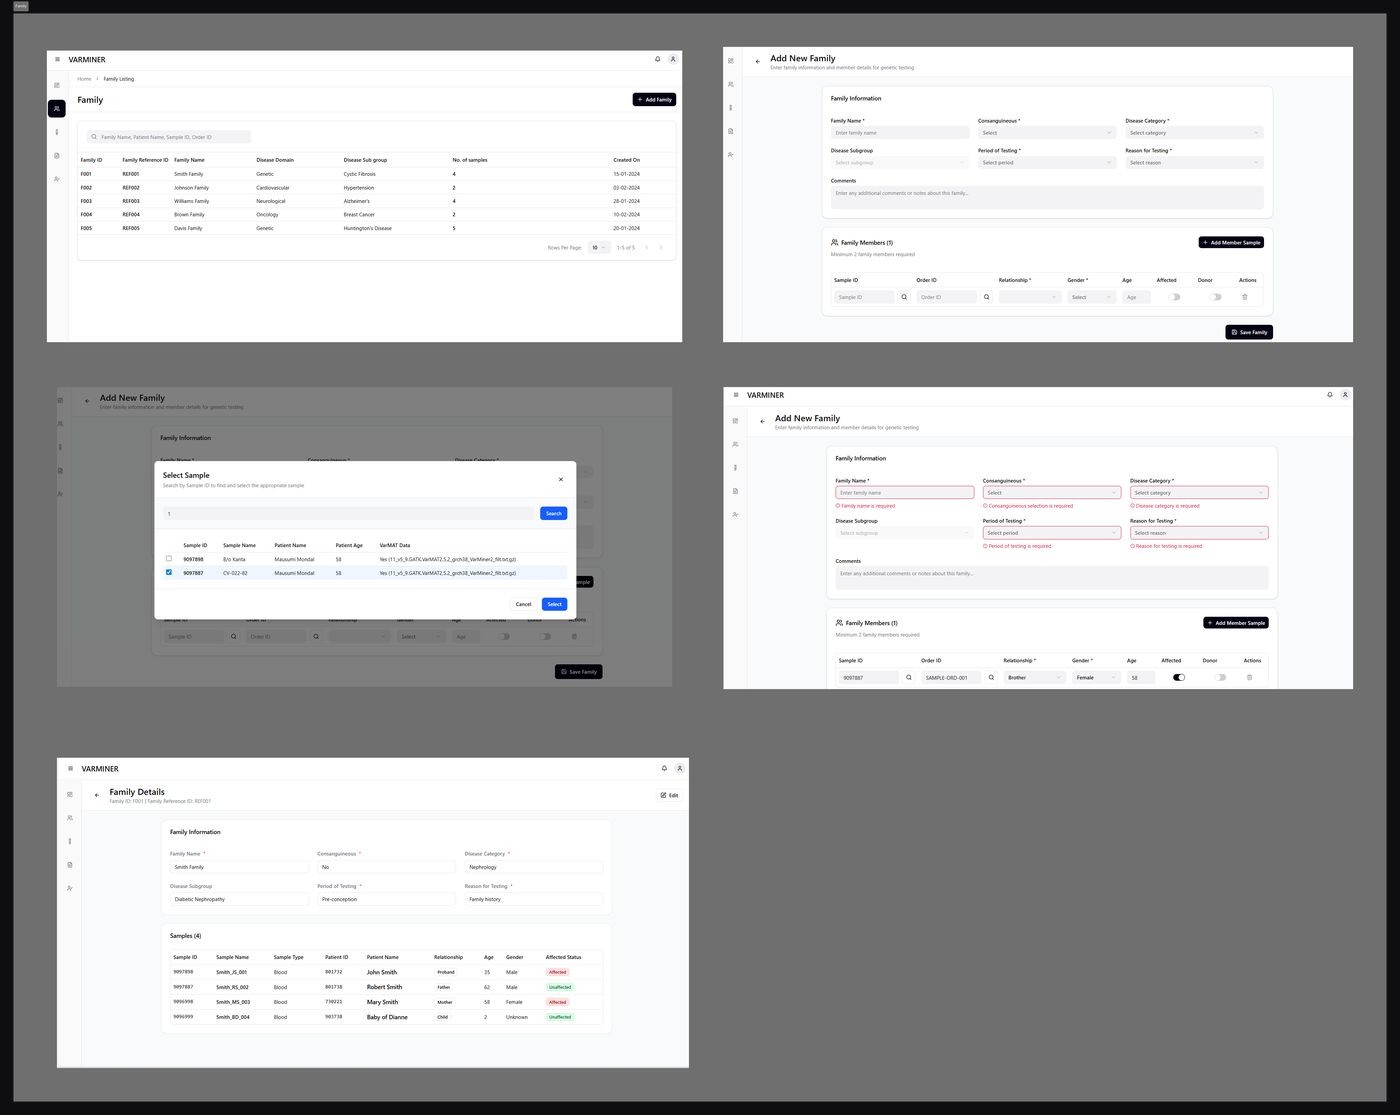
Family listing, add family with member samples, family details — supporting carrier, duo, and trio analysis workflows.
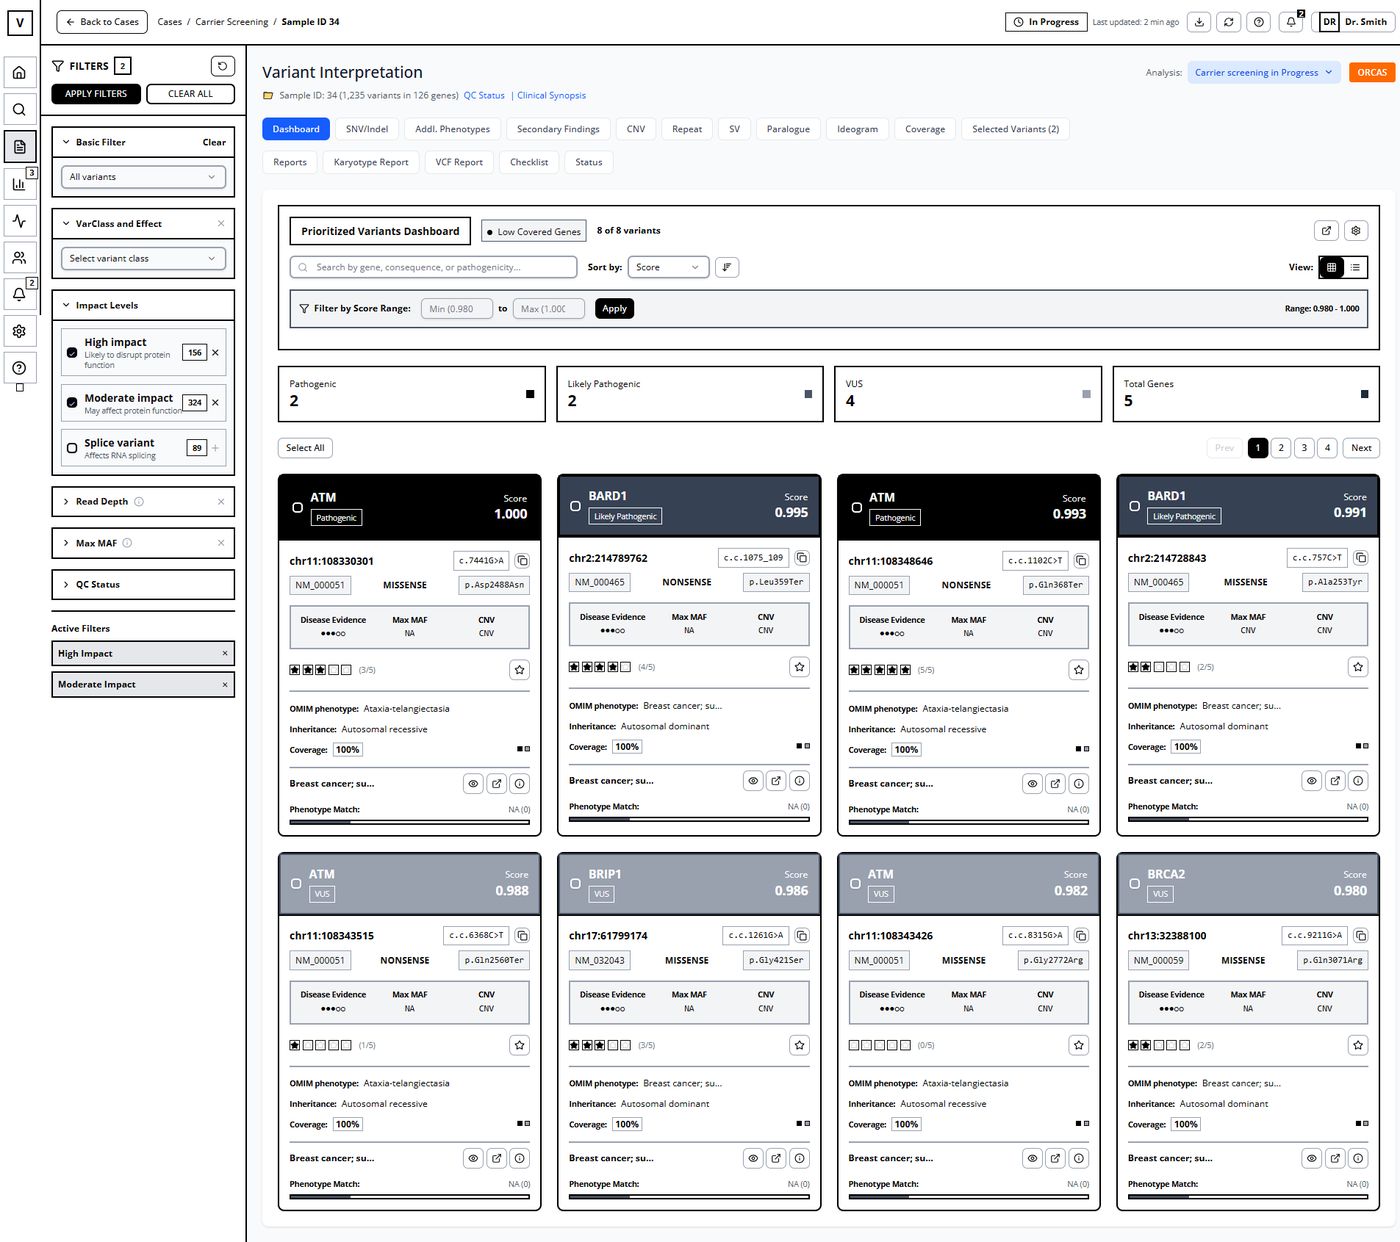
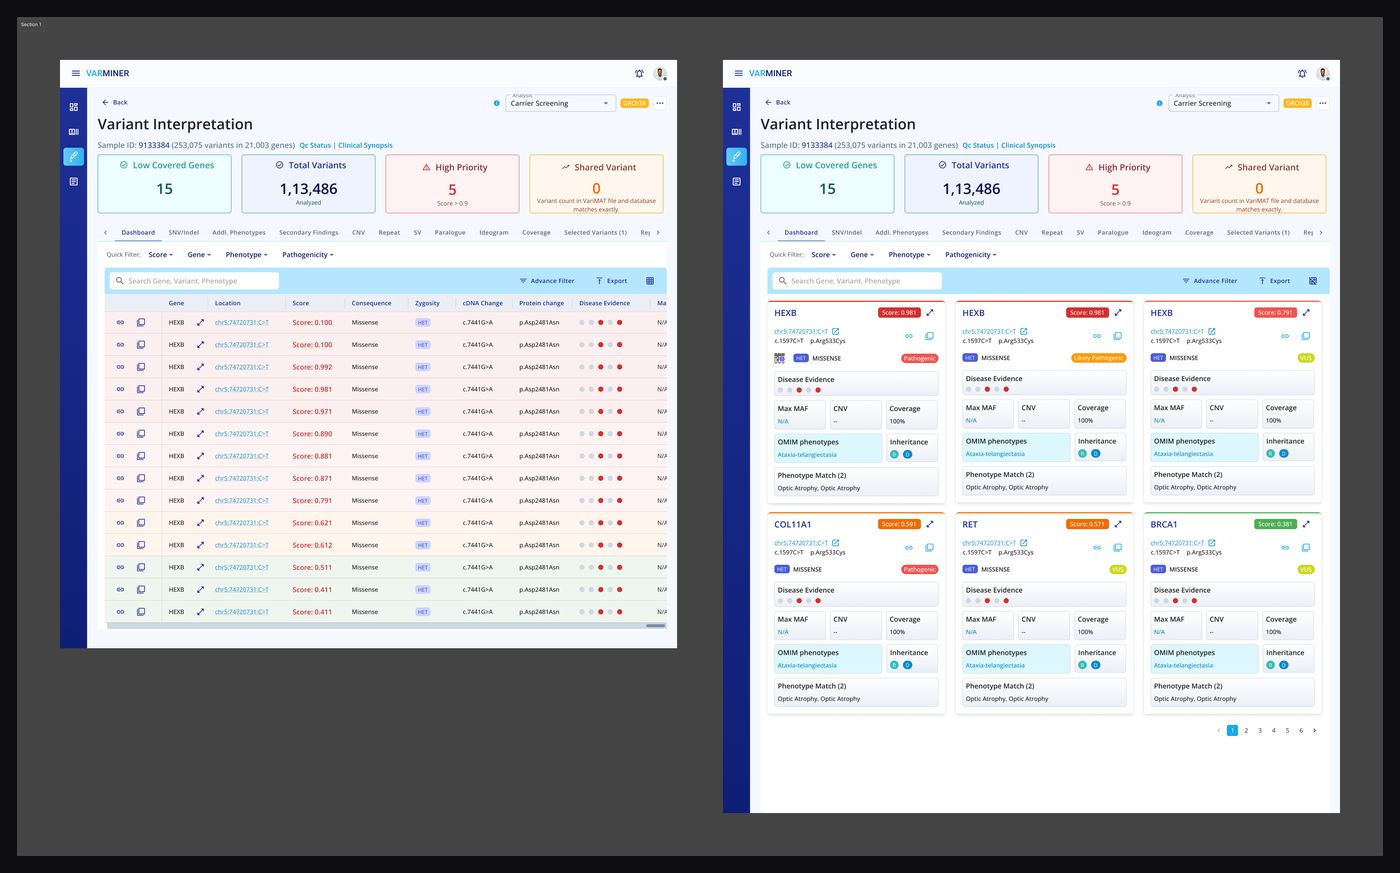
The most data-dense screen. Filters, variant cards with pathogenicity scores, disease evidence, and phenotype matching.
Visual direction,
then a design system.
From wireframes, I moved through fidelity in deliberate steps. Moodboard first to align on visual direction. Design system next. High-fidelity screens last.
Moodboard
I set the visual direction and agreed it with the client before high-fidelity work began.
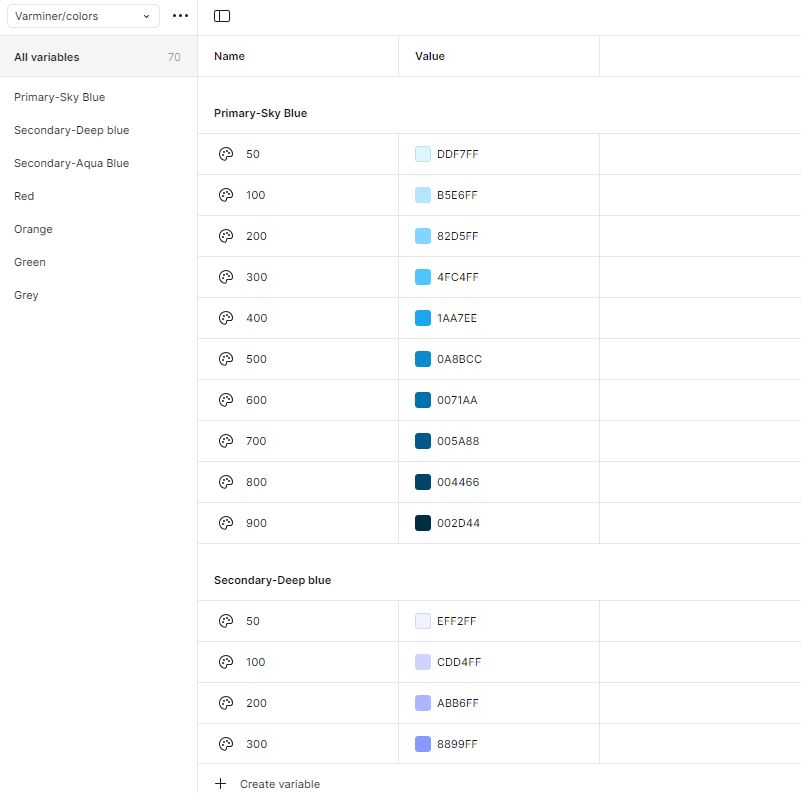
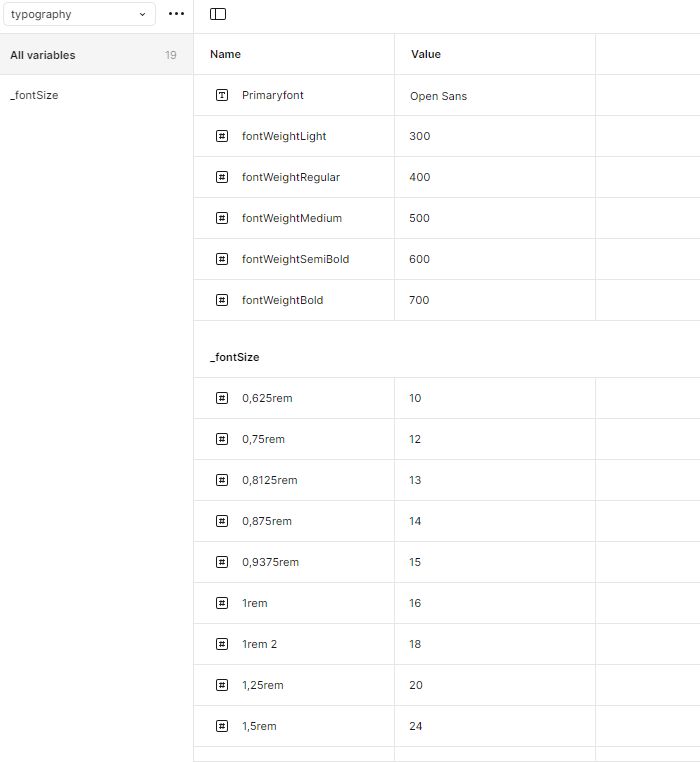
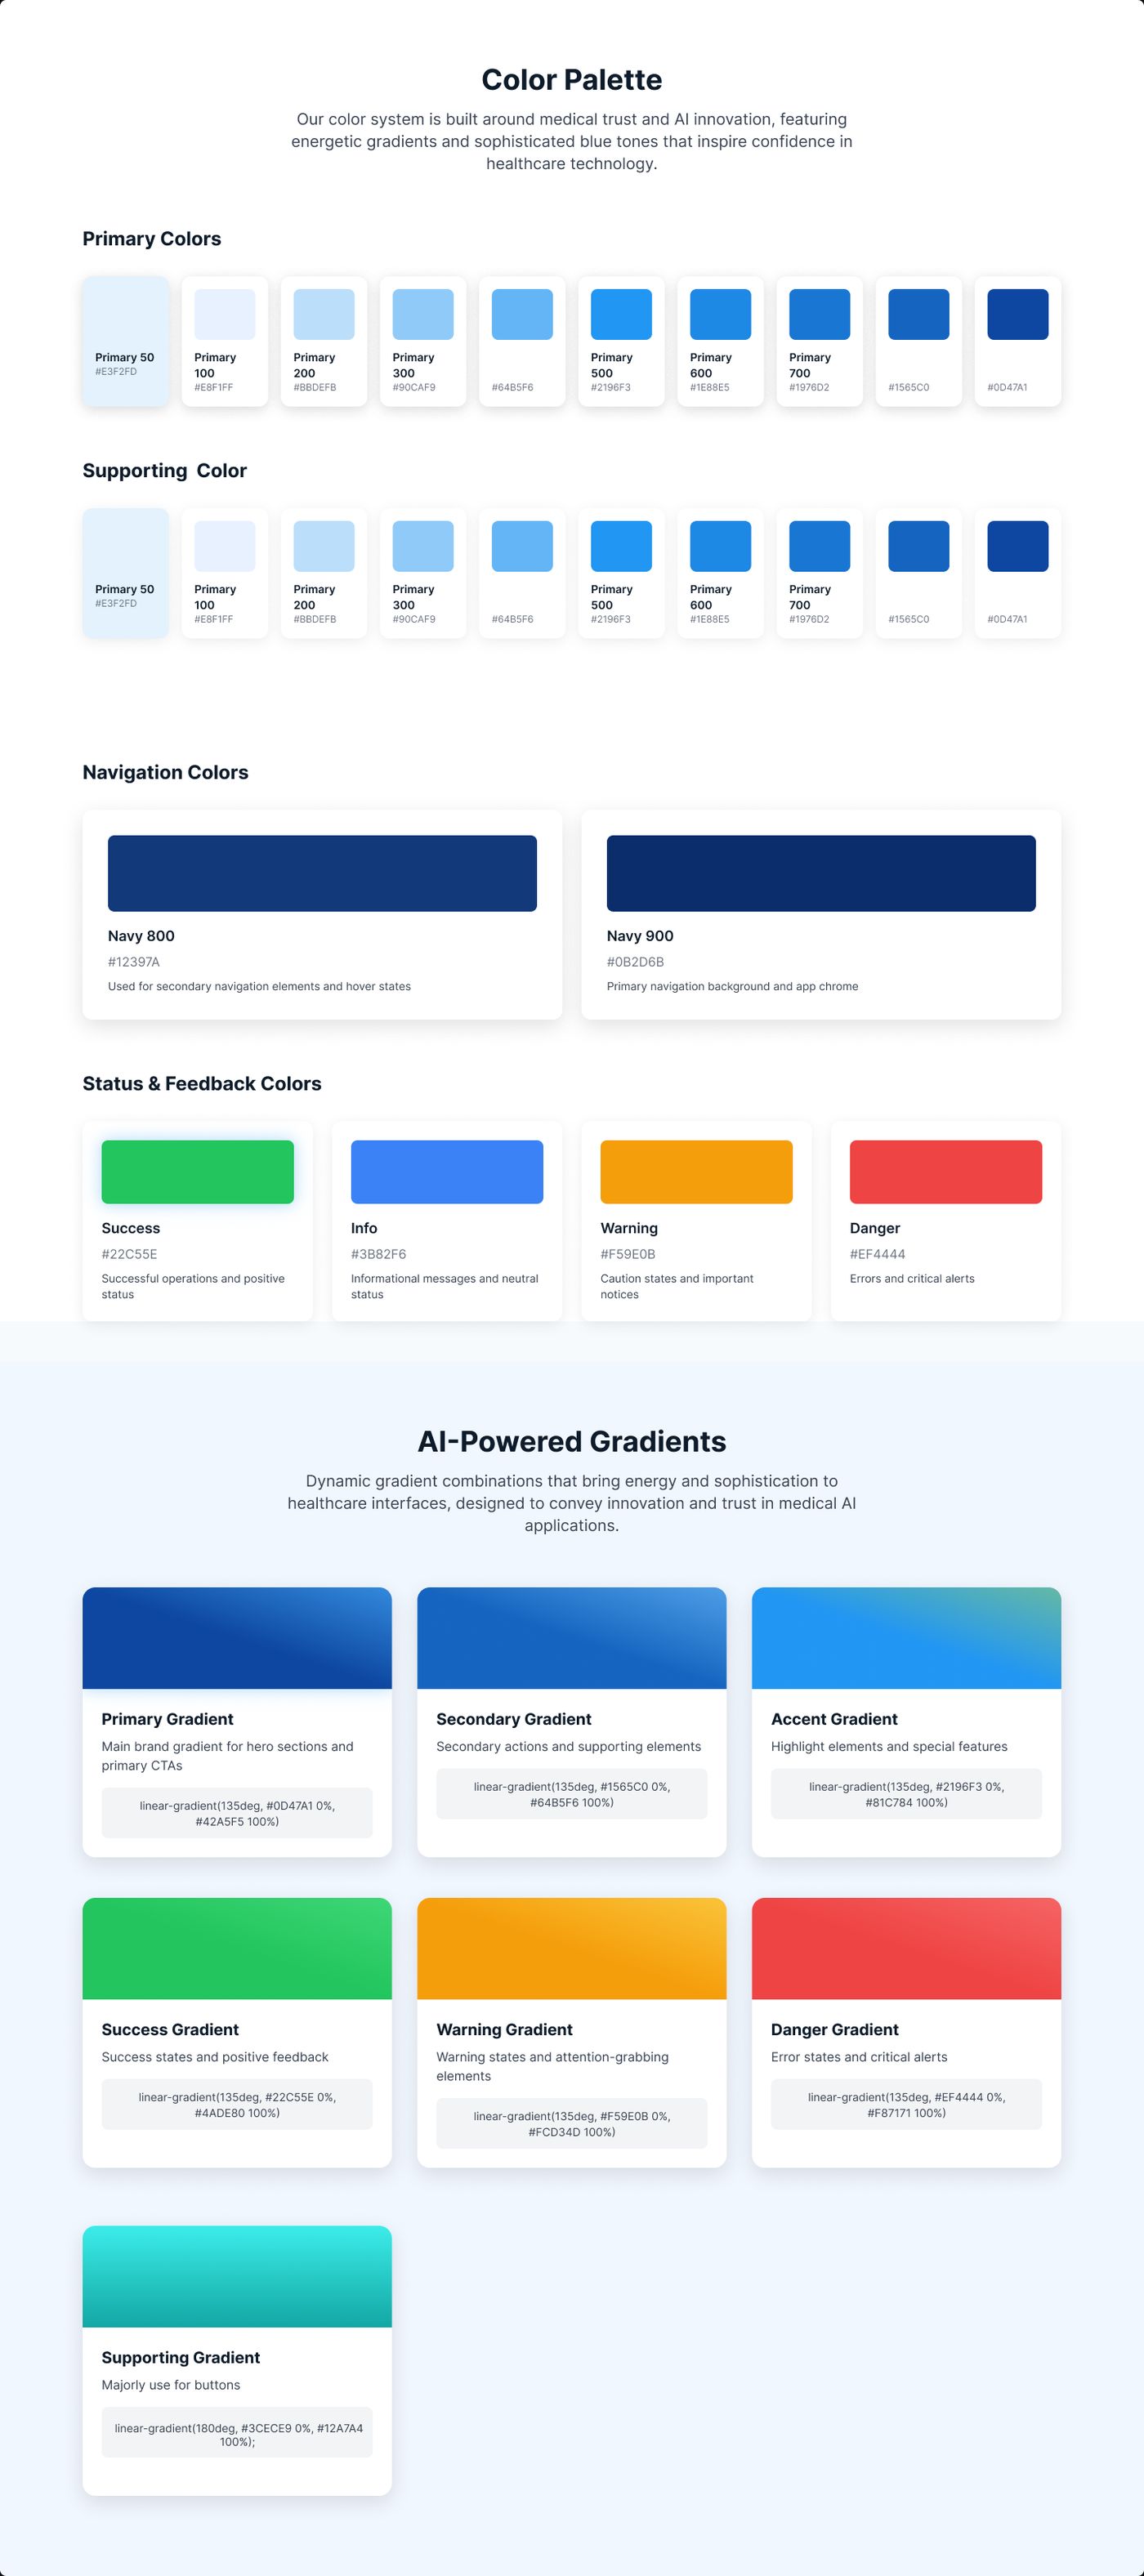
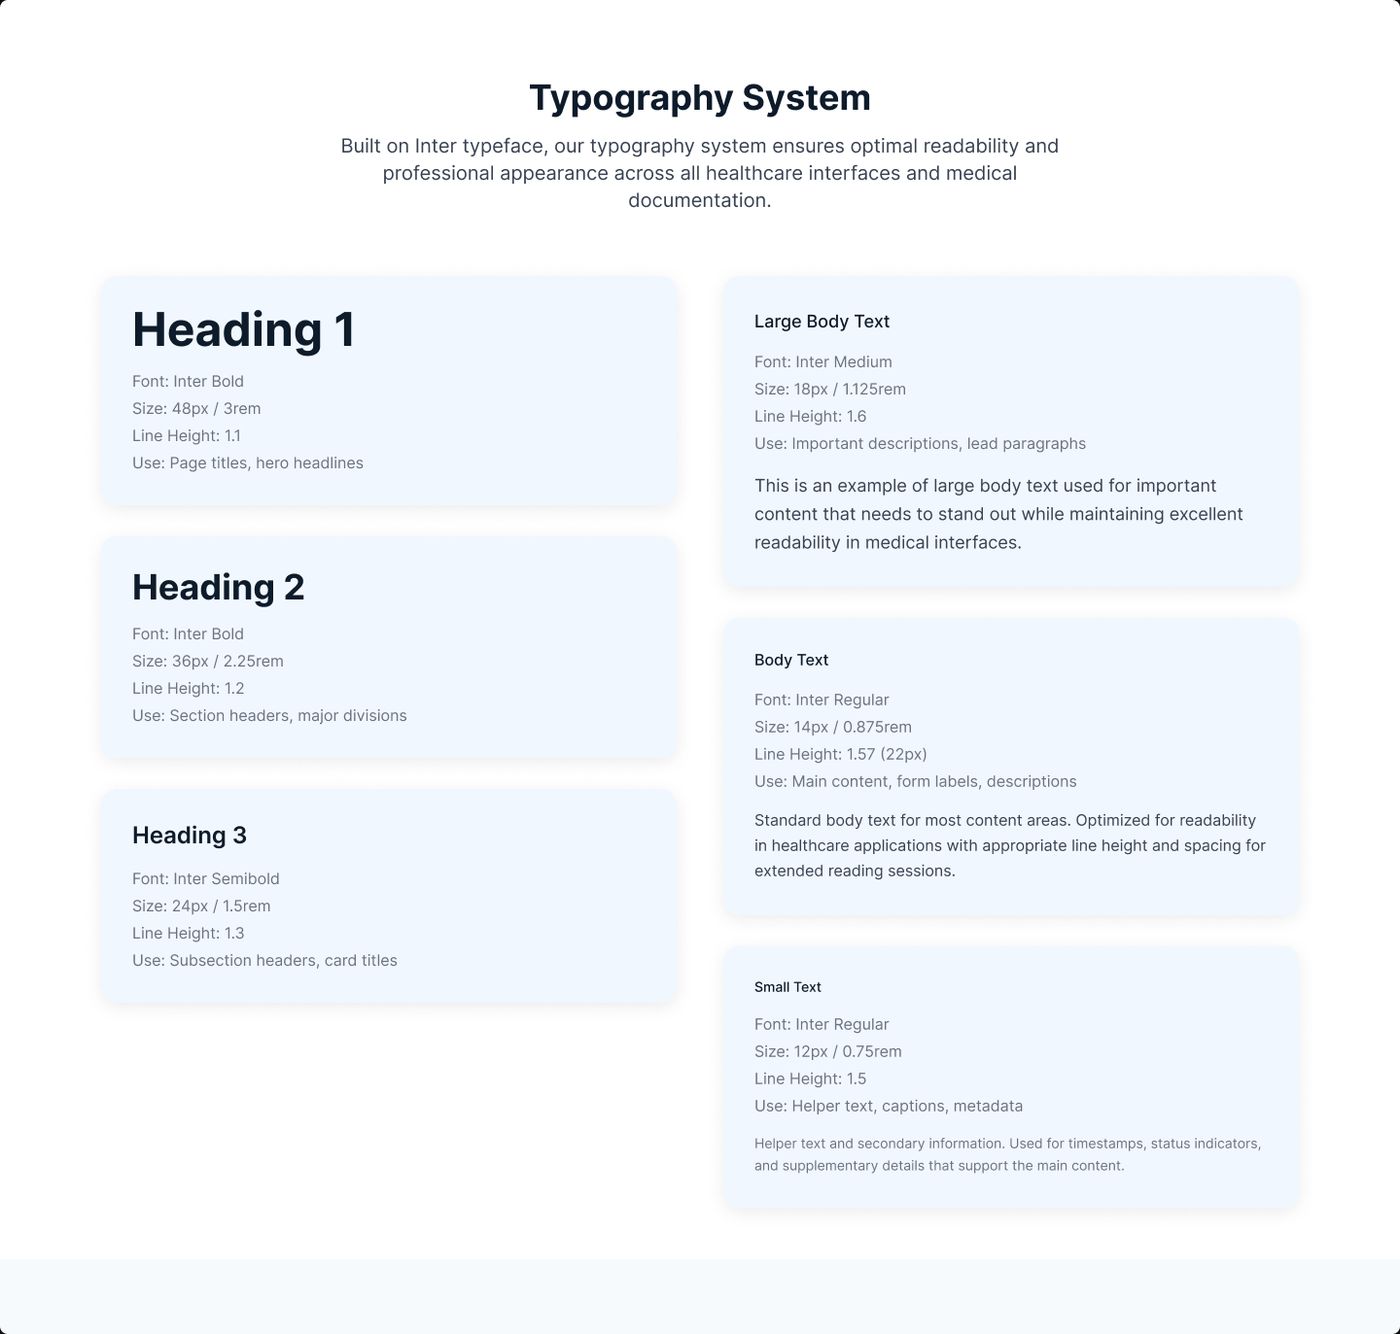
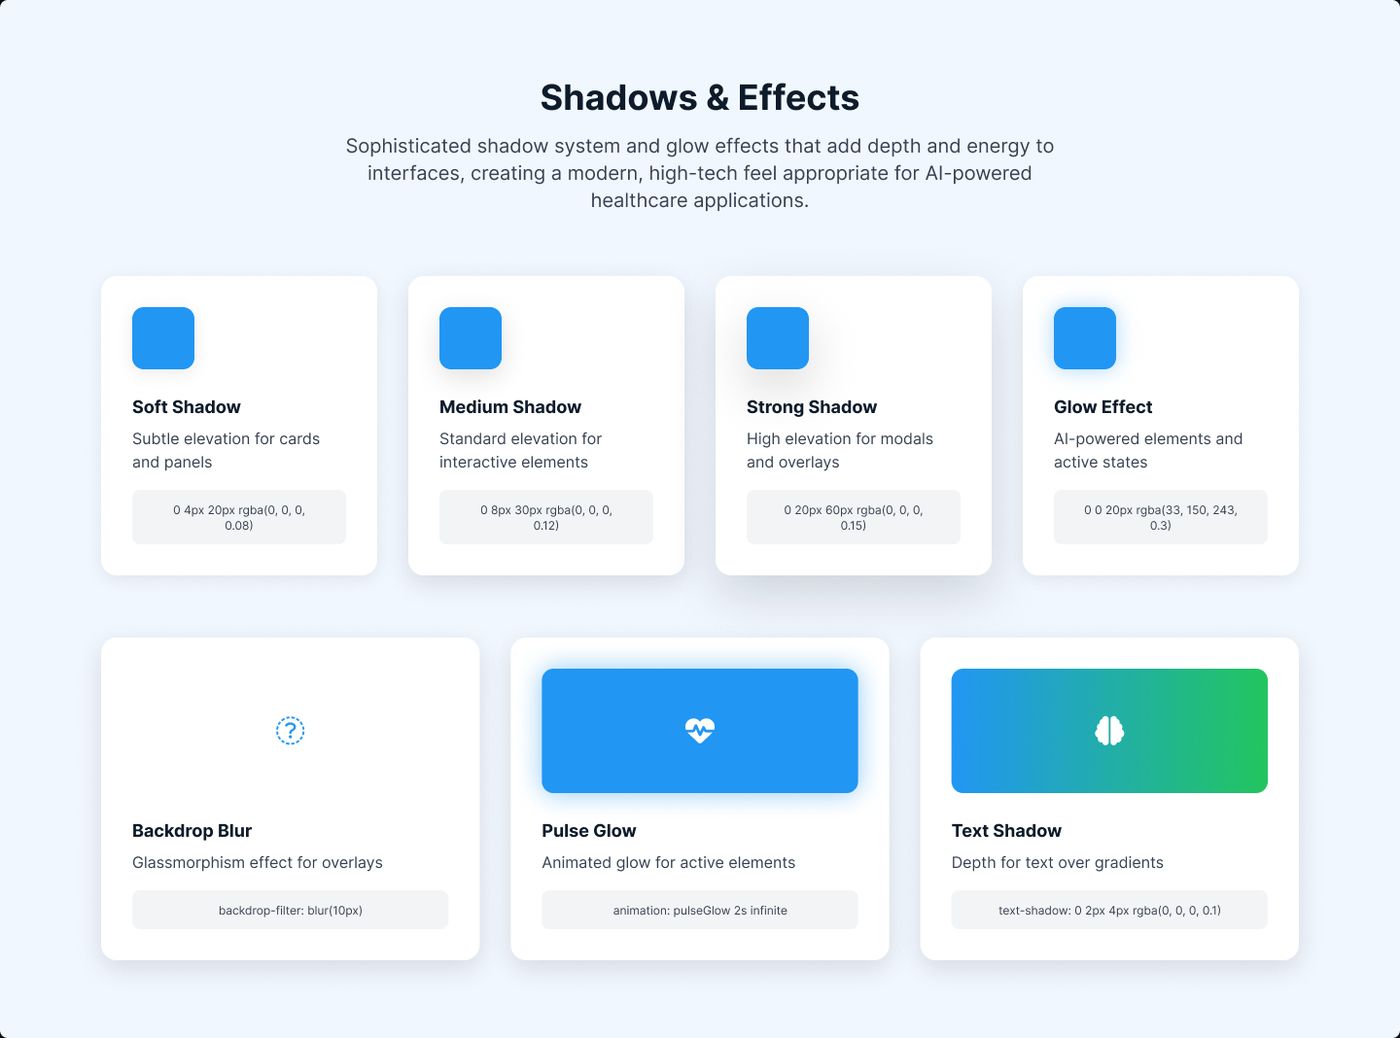
Design System
I built the system on design tokens, using variables for colour, typography, spacing, shadows, and components. This kept the product visually consistent and made it far easier to scale.
High-Fidelity Screens
I designed the full experience including authentication, sample management, patient management, and variant interpretation.
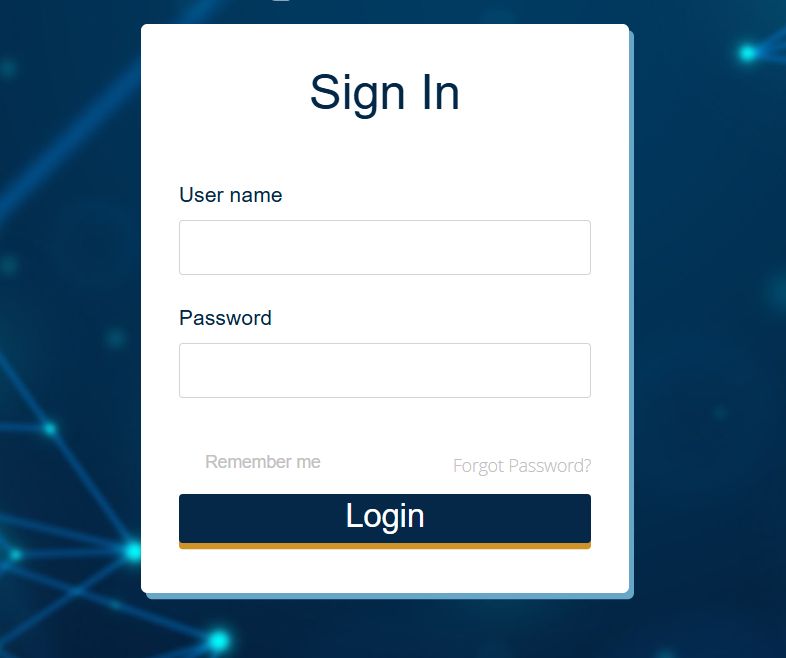
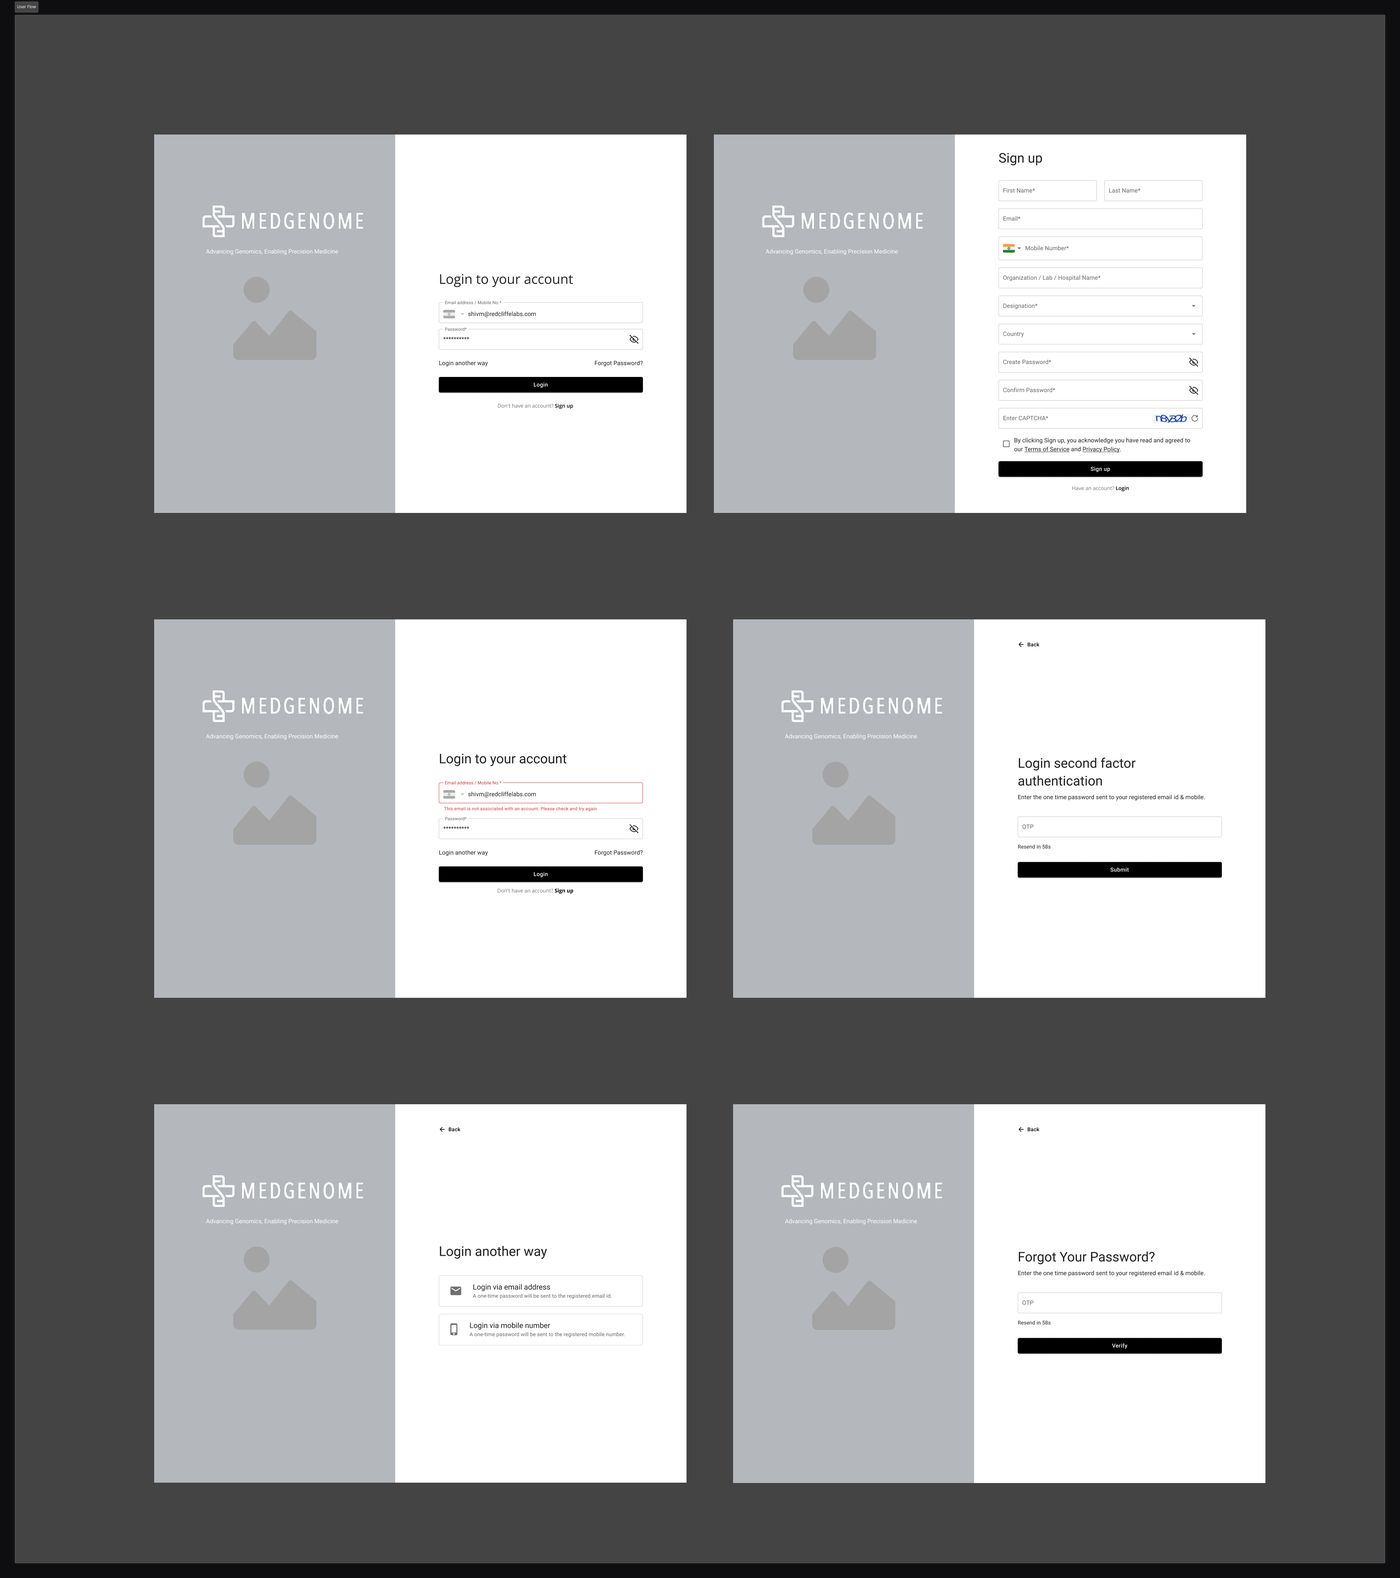
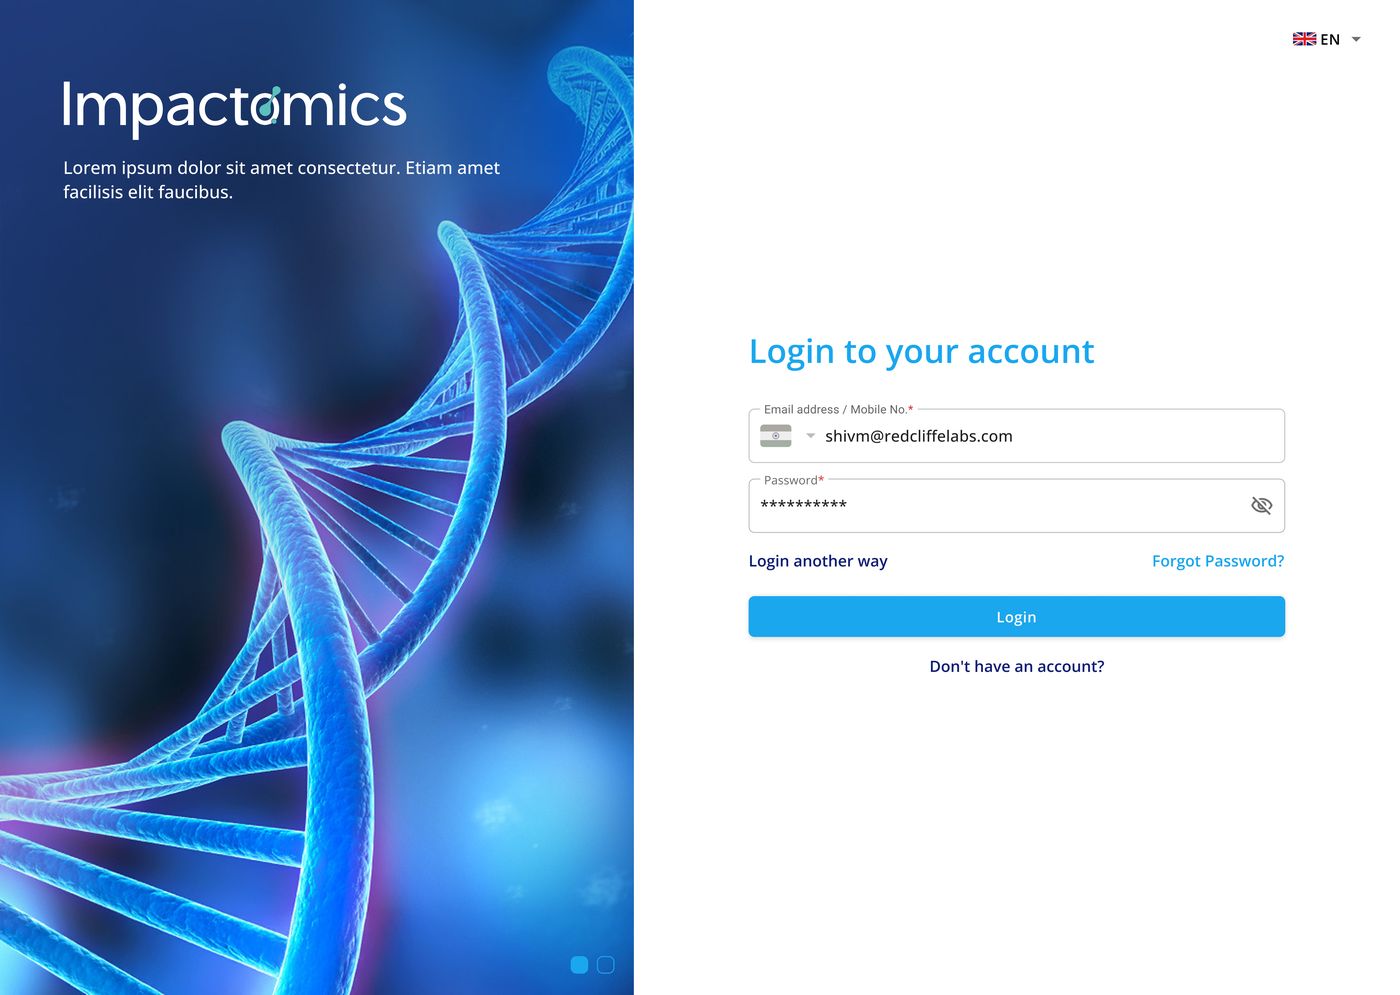
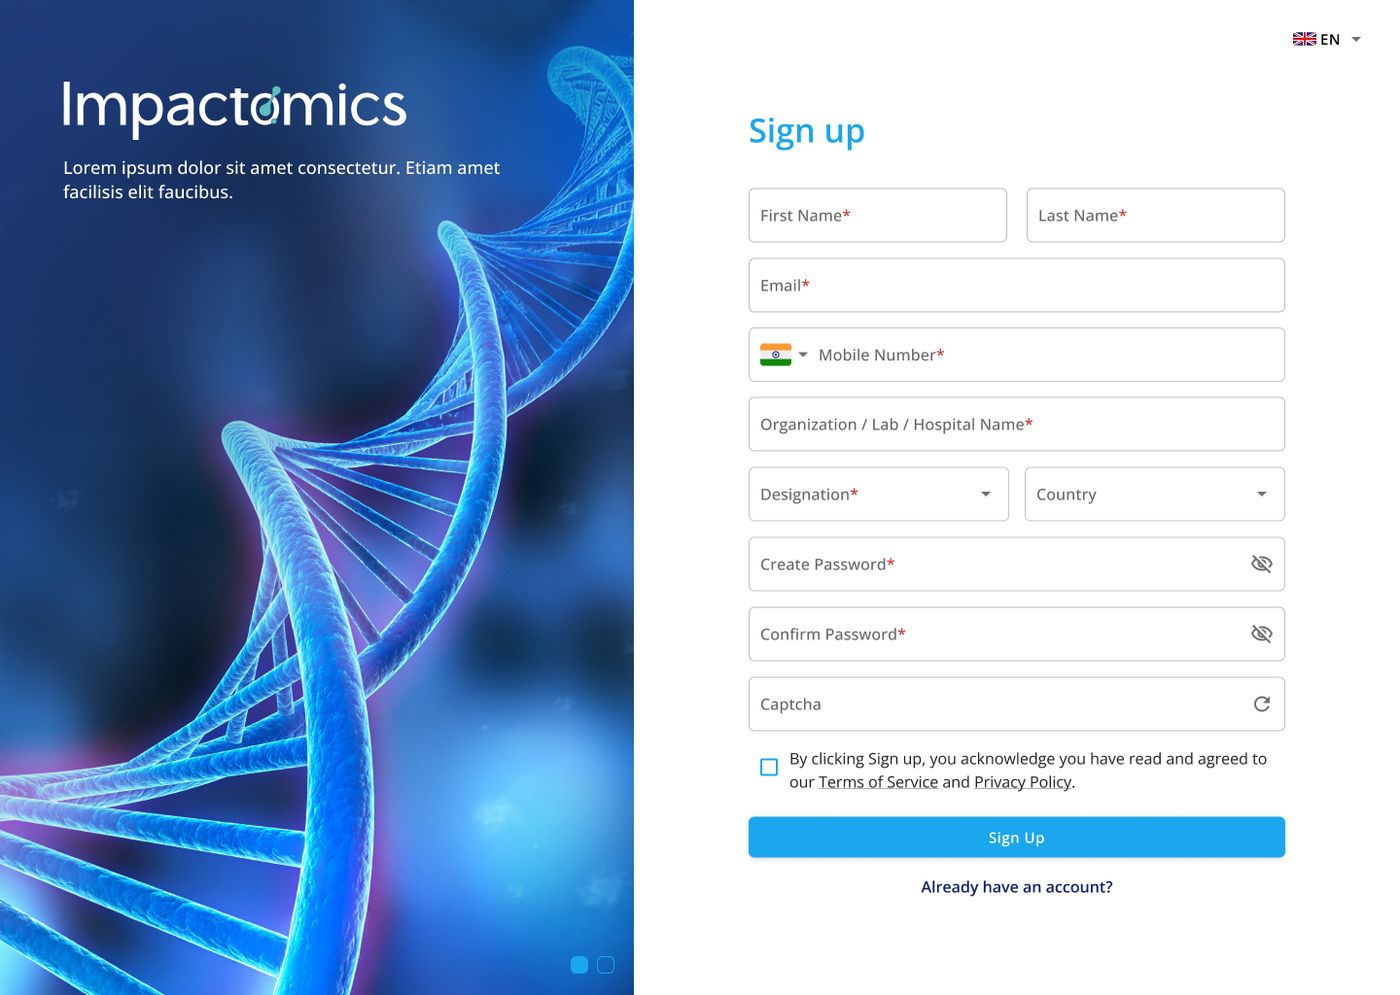
Login and Sign Up with DNA helix hero imagery, multi-language support, and 2FA flow.
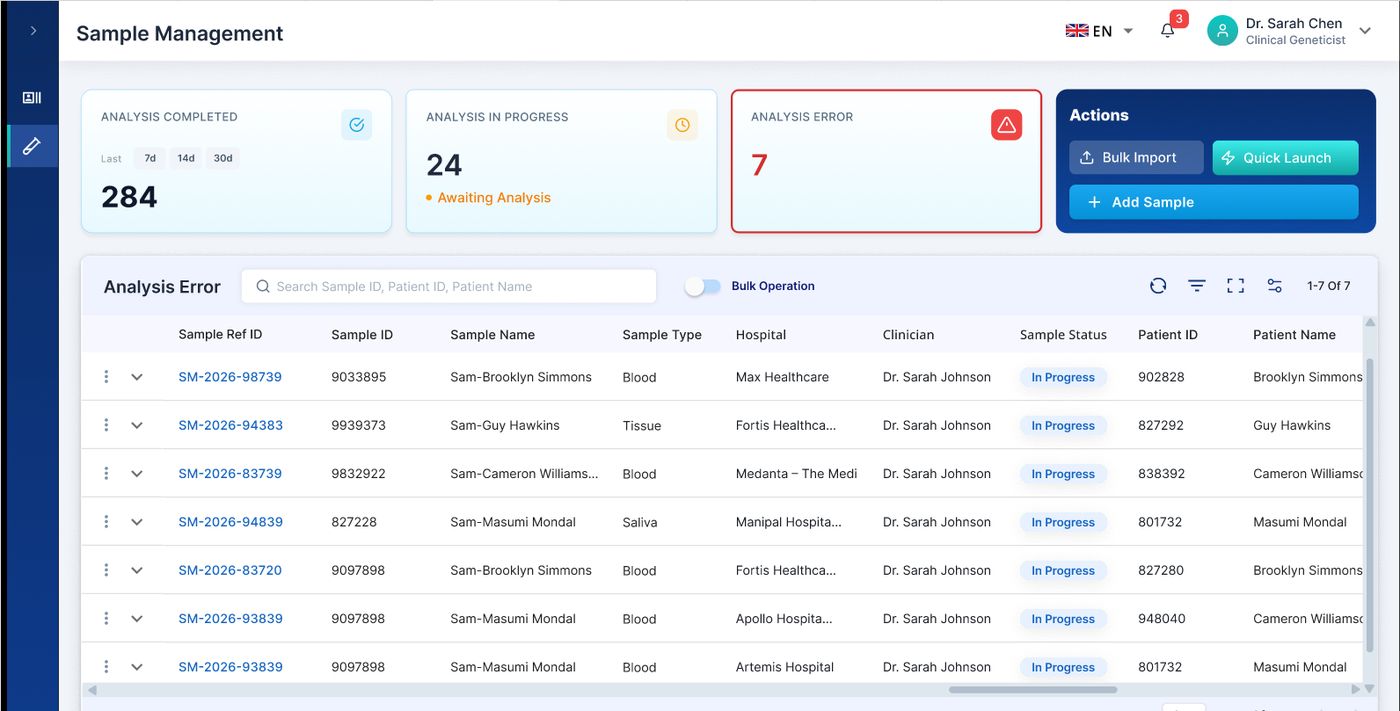
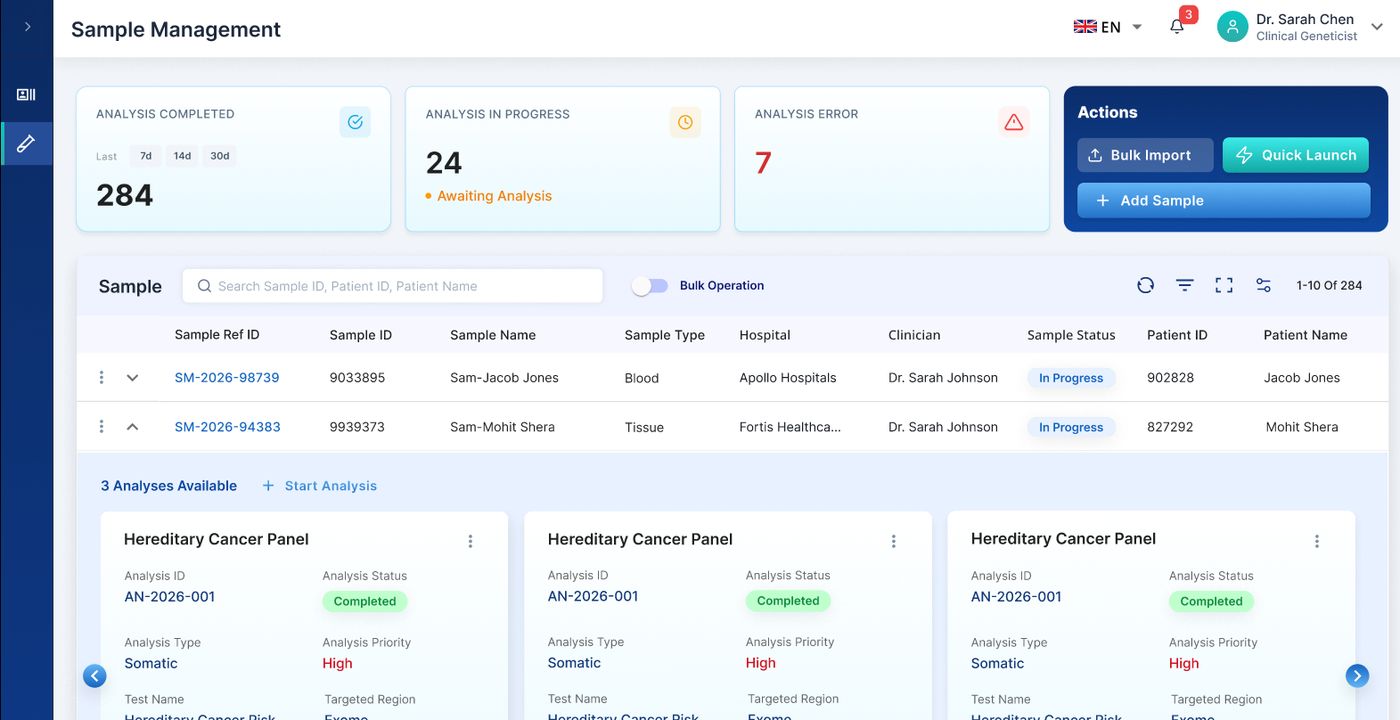
Status dashboard with completed, in-progress, and error counts. Sample listing with expandable rows and analysis cards.
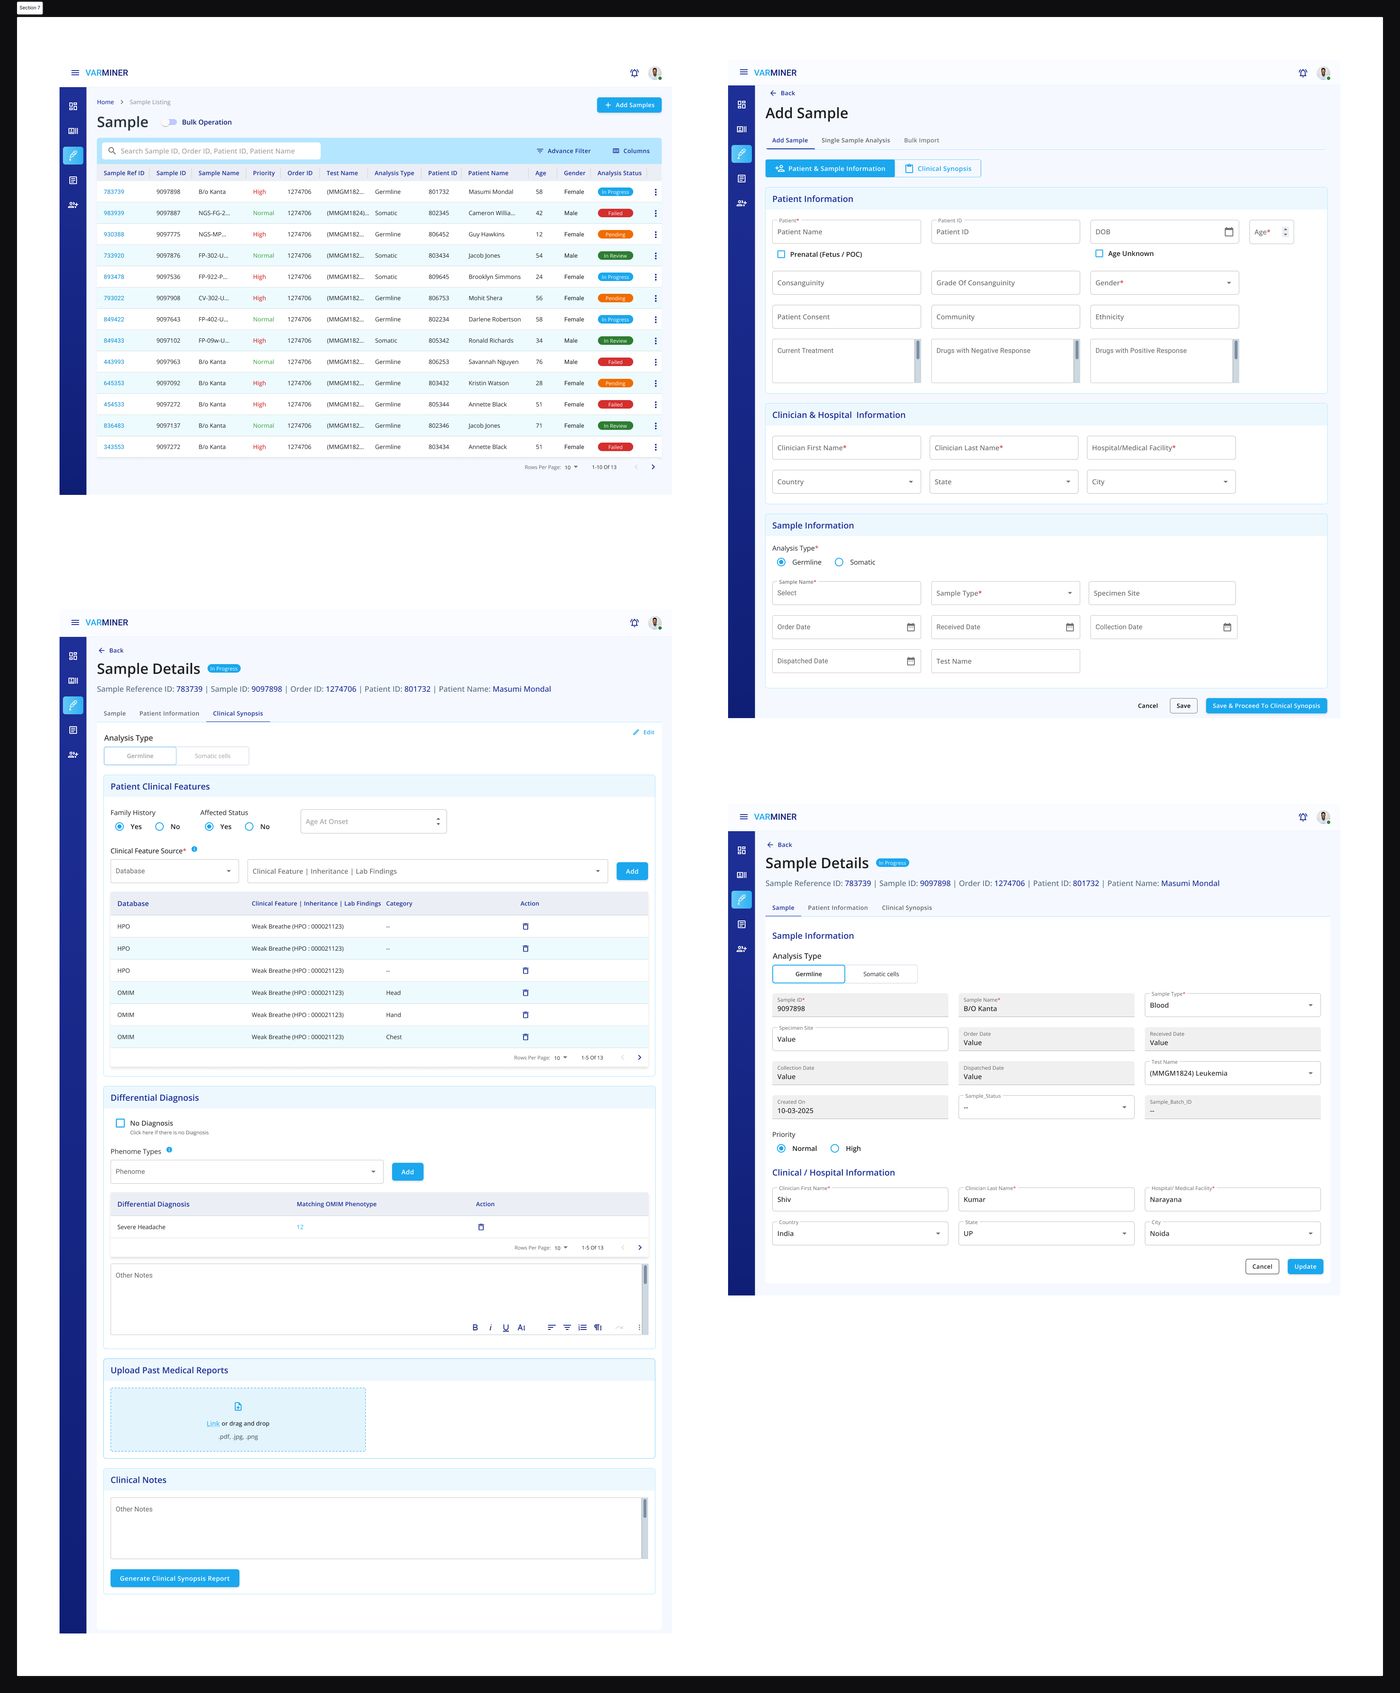
Redesigned patient listing with bulk operations, advanced filters, column customisation, and inline sample preview.

Old: flat table where every variant had equal weight. New: card-based layout with pathogenicity scores, disease evidence, and phenotype matching. Clinical urgency visible at a glance.
Three problems found.
Three fixes shipped.
I ran moderated, task-based usability testing remotely over video call. I gave users real tasks — adding a sample, reaching key actions, interpreting a variant — and watched where they hesitated, slowed down, or got stuck.
Problems Testing Caught
High-frequency actions were buried. Users had to navigate multiple layers to reach tasks they performed daily.
A routine task required navigating a dense multi-step process that users found slow and error-prone.
The variant screen presented everything at once with no visual prioritisation.
Updated Style Guide
After testing and iteration, the design system was fully documented — colour palette, typography system, and effects library.
V2 Screens — After Testing
A single side panel combining patient and sample fields. Only mandatory fields shown. Users found this fast and easy.
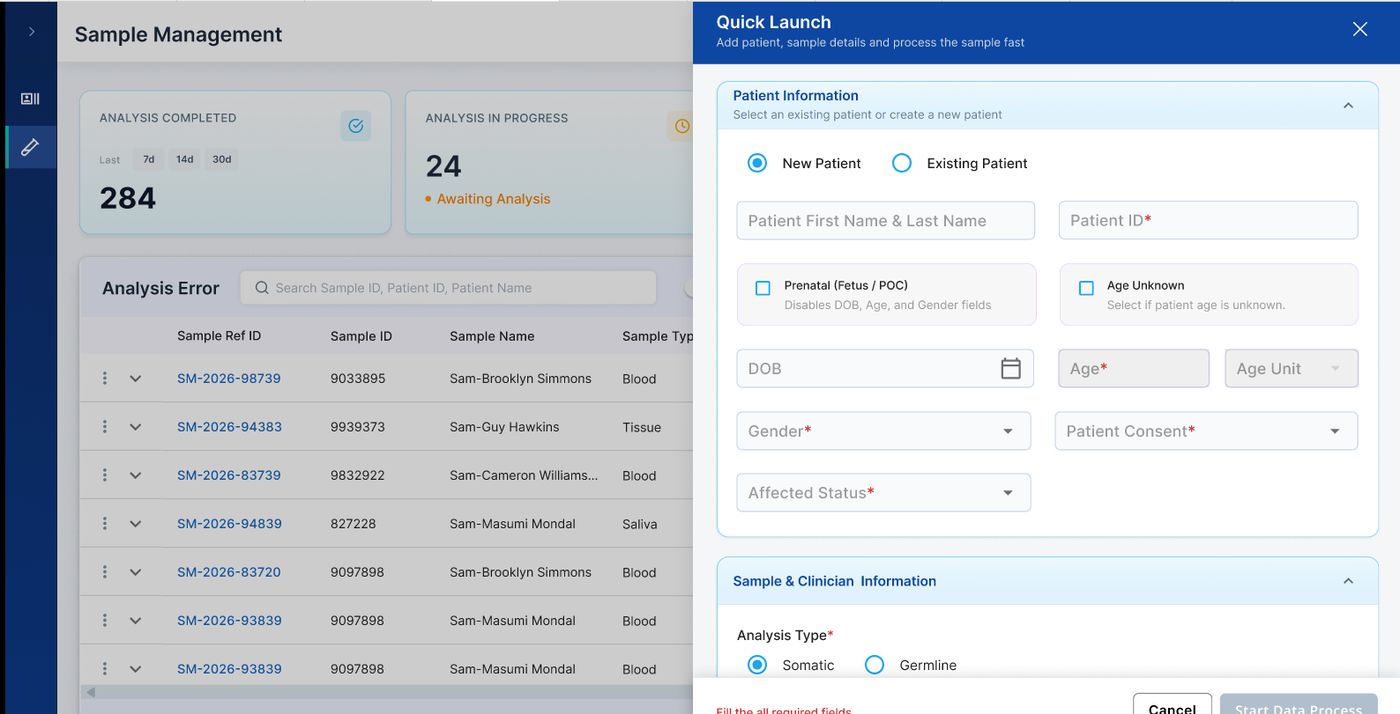
Patient Info → Sample & Clinician Info → Clinical Synopsis → Lab Details → File Details. Clear progress at every step.
Status cards (completed, in progress, errors) give immediate orientation. Expandable rows reveal analysis cards without leaving the listing.
Complete sample workflow with clinical synopsis, differential diagnosis, clinical notes, and report generation surfaced clearly at the end.
Measurable improvement
from task-based testing.
In moderated, task-based testing, 4 of 5 users completed the core task within the expected time. The redesign resolved the three friction points that testing had exposed.
Users completed the core task within the expected time in moderated testing.
Report generation reduced from 10 to 6 steps, so reports were quicker to produce.
Quick Launch, guided Add Sample wizard, and simplified Variant Interpretation — all caught in testing, all fixed before launch.
A legacy tool turned into
a platform for faster,
more confident decisions.
The redesign delivered a cleaner, more intuitive, and more scalable experience. By bringing user research and business goals together, I turned a hard-to-use legacy tool into a product that supports faster, more confident clinical decisions.
Clinical accuracy fully preserved. Cognitive load reduced through structure, not subtraction.
Every design change traced back to something a real user struggled with.
A token-based design system means new features can be added without breaking consistency.